Celtic vs Sudanese Births to Unmarried Women
COMPARE
Celtic
Sudanese
Births to Unmarried Women
Births to Unmarried Women Comparison
Celtics
Sudanese
33.3%
BIRTHS TO UNMARRIED WOMEN
10.2/ 100
METRIC RATING
212th/ 347
METRIC RANK
32.4%
BIRTHS TO UNMARRIED WOMEN
27.3/ 100
METRIC RATING
194th/ 347
METRIC RANK
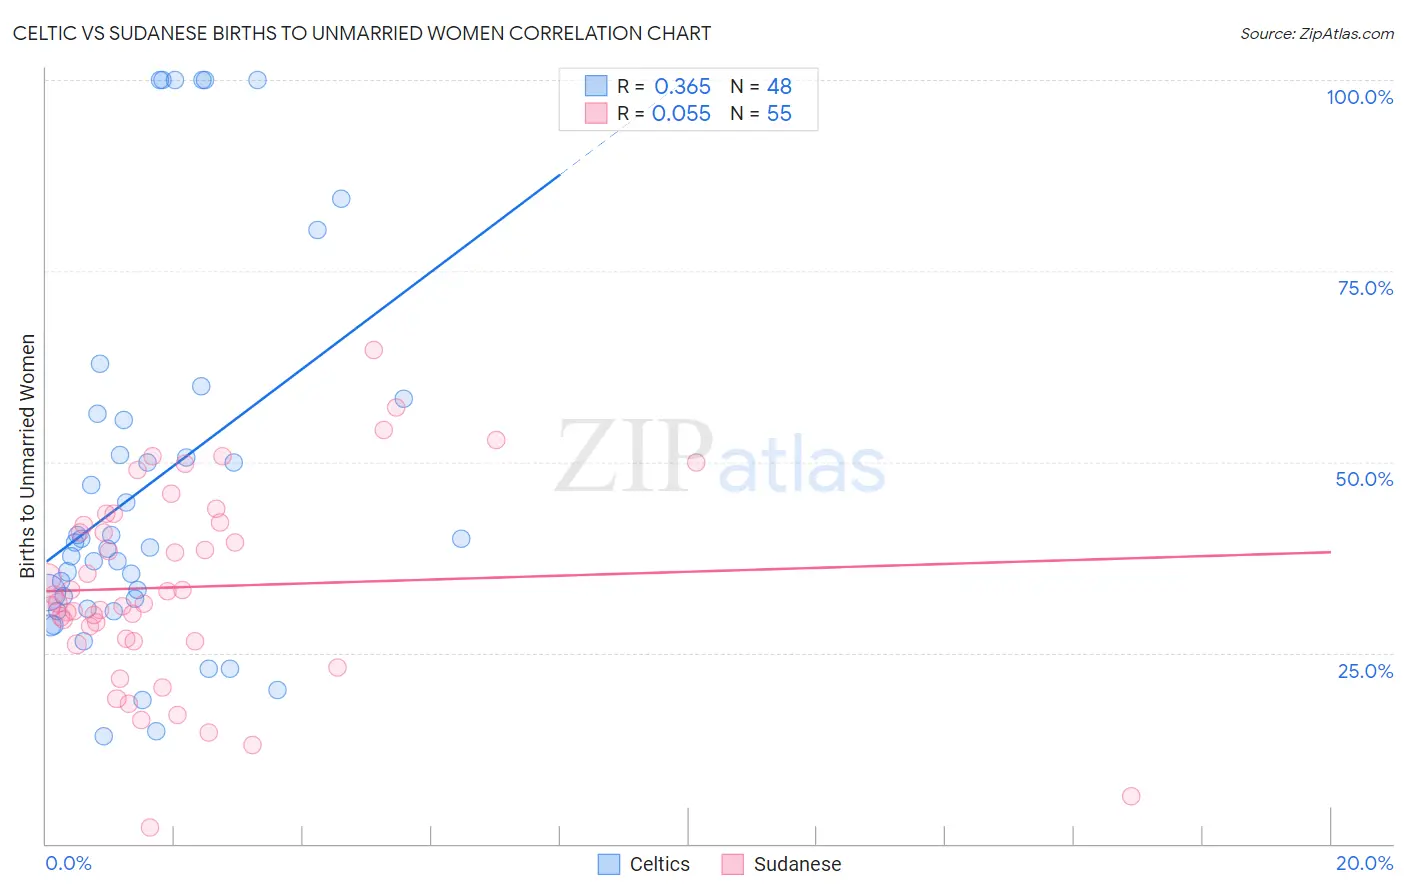
Celtic vs Sudanese Births to Unmarried Women Correlation Chart
The statistical analysis conducted on geographies consisting of 162,463,744 people shows a mild positive correlation between the proportion of Celtics and percentage of births to unmarried women in the United States with a correlation coefficient (R) of 0.365 and weighted average of 33.3%. Similarly, the statistical analysis conducted on geographies consisting of 107,881,308 people shows a slight positive correlation between the proportion of Sudanese and percentage of births to unmarried women in the United States with a correlation coefficient (R) of 0.055 and weighted average of 32.4%, a difference of 2.8%.
Births to Unmarried Women Correlation Summary
| Measurement | Celtic | Sudanese |
| Minimum | 14.0% | 2.2% |
| Maximum | 100.0% | 64.6% |
| Range | 86.0% | 62.4% |
| Mean | 47.2% | 33.6% |
| Median | 39.1% | 31.5% |
| Interquartile 25% (IQ1) | 31.5% | 26.5% |
| Interquartile 75% (IQ3) | 55.9% | 42.0% |
| Interquartile Range (IQR) | 24.4% | 15.5% |
| Standard Deviation (Sample) | 24.7% | 12.8% |
| Standard Deviation (Population) | 24.5% | 12.6% |
Demographics Similar to Celtics and Sudanese by Births to Unmarried Women
In terms of births to unmarried women, the demographic groups most similar to Celtics are Ecuadorian (33.3%, a difference of 0.070%), White/Caucasian (33.3%, a difference of 0.12%), Scotch-Irish (33.3%, a difference of 0.12%), Immigrants from Costa Rica (33.4%, a difference of 0.19%), and Hawaiian (33.2%, a difference of 0.25%). Similarly, the demographic groups most similar to Sudanese are Fijian (32.3%, a difference of 0.42%), Samoan (32.6%, a difference of 0.67%), Immigrants from Colombia (32.6%, a difference of 0.70%), Immigrants (32.7%, a difference of 0.85%), and Costa Rican (32.7%, a difference of 0.90%).
| Demographics | Rating | Rank | Births to Unmarried Women |
| Fijians | 31.1 /100 | #193 | Fair 32.3% |
| Sudanese | 27.3 /100 | #194 | Fair 32.4% |
| Samoans | 21.9 /100 | #195 | Fair 32.6% |
| Immigrants | Colombia | 21.7 /100 | #196 | Fair 32.6% |
| Immigrants | Immigrants | 20.6 /100 | #197 | Fair 32.7% |
| Costa Ricans | 20.3 /100 | #198 | Fair 32.7% |
| Immigrants | Thailand | 18.9 /100 | #199 | Poor 32.8% |
| Immigrants | Germany | 18.8 /100 | #200 | Poor 32.8% |
| Immigrants | Burma/Myanmar | 16.7 /100 | #201 | Poor 32.9% |
| Immigrants | Micronesia | 16.6 /100 | #202 | Poor 32.9% |
| Ute | 14.4 /100 | #203 | Poor 33.0% |
| Immigrants | Africa | 14.3 /100 | #204 | Poor 33.0% |
| German Russians | 13.1 /100 | #205 | Poor 33.1% |
| Uruguayans | 12.8 /100 | #206 | Poor 33.1% |
| Immigrants | Sudan | 11.5 /100 | #207 | Poor 33.2% |
| Hawaiians | 11.3 /100 | #208 | Poor 33.2% |
| Whites/Caucasians | 10.7 /100 | #209 | Poor 33.3% |
| Scotch-Irish | 10.7 /100 | #210 | Poor 33.3% |
| Ecuadorians | 10.5 /100 | #211 | Poor 33.3% |
| Celtics | 10.2 /100 | #212 | Poor 33.3% |
| Immigrants | Costa Rica | 9.5 /100 | #213 | Tragic 33.4% |