Immigrants from Armenia vs Sudanese Self-Care Disability
COMPARE
Immigrants from Armenia
Sudanese
Self-Care Disability
Self-Care Disability Comparison
Immigrants from Armenia
Sudanese
4.2%
SELF-CARE DISABILITY
0.0/ 100
METRIC RATING
347th/ 347
METRIC RANK
2.2%
SELF-CARE DISABILITY
100.0/ 100
METRIC RATING
10th/ 347
METRIC RANK
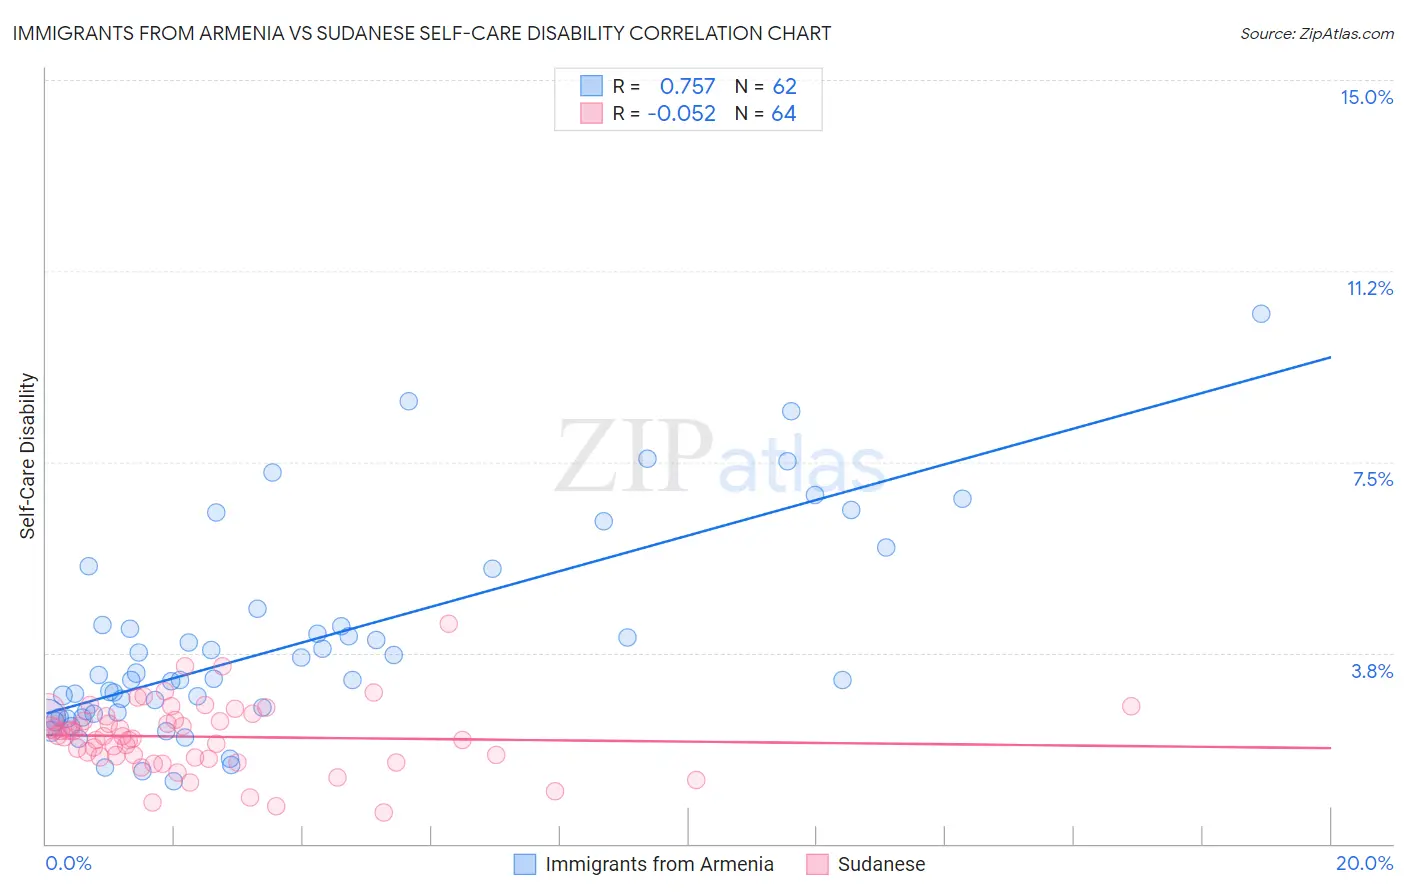
Immigrants from Armenia vs Sudanese Self-Care Disability Correlation Chart
The statistical analysis conducted on geographies consisting of 97,700,999 people shows a strong positive correlation between the proportion of Immigrants from Armenia and percentage of population with self-care disability in the United States with a correlation coefficient (R) of 0.757 and weighted average of 4.2%. Similarly, the statistical analysis conducted on geographies consisting of 110,094,977 people shows a slight negative correlation between the proportion of Sudanese and percentage of population with self-care disability in the United States with a correlation coefficient (R) of -0.052 and weighted average of 2.2%, a difference of 90.7%.
Self-Care Disability Correlation Summary
| Measurement | Immigrants from Armenia | Sudanese |
| Minimum | 1.2% | 0.62% |
| Maximum | 10.4% | 4.3% |
| Range | 9.2% | 3.7% |
| Mean | 3.9% | 2.1% |
| Median | 3.2% | 2.1% |
| Interquartile 25% (IQ1) | 2.6% | 1.7% |
| Interquartile 75% (IQ3) | 4.3% | 2.5% |
| Interquartile Range (IQR) | 1.7% | 0.78% |
| Standard Deviation (Sample) | 2.0% | 0.67% |
| Standard Deviation (Population) | 2.0% | 0.67% |
Similar Demographics by Self-Care Disability
Demographics Similar to Immigrants from Armenia by Self-Care Disability
In terms of self-care disability, the demographic groups most similar to Immigrants from Armenia are Puerto Rican (3.7%, a difference of 13.7%), Armenian (3.4%, a difference of 22.7%), Pueblo (3.3%, a difference of 28.2%), Tohono O'odham (3.1%, a difference of 34.1%), and Colville (3.1%, a difference of 34.2%).
| Demographics | Rating | Rank | Self-Care Disability |
| Dutch West Indians | 0.0 /100 | #333 | Tragic 3.0% |
| Houma | 0.0 /100 | #334 | Tragic 3.0% |
| Immigrants | Azores | 0.0 /100 | #335 | Tragic 3.0% |
| Immigrants | Yemen | 0.0 /100 | #336 | Tragic 3.0% |
| Choctaw | 0.0 /100 | #337 | Tragic 3.0% |
| Cape Verdeans | 0.0 /100 | #338 | Tragic 3.0% |
| Immigrants | Dominican Republic | 0.0 /100 | #339 | Tragic 3.0% |
| Immigrants | Cabo Verde | 0.0 /100 | #340 | Tragic 3.1% |
| Dominicans | 0.0 /100 | #341 | Tragic 3.1% |
| Colville | 0.0 /100 | #342 | Tragic 3.1% |
| Tohono O'odham | 0.0 /100 | #343 | Tragic 3.1% |
| Pueblo | 0.0 /100 | #344 | Tragic 3.3% |
| Armenians | 0.0 /100 | #345 | Tragic 3.4% |
| Puerto Ricans | 0.0 /100 | #346 | Tragic 3.7% |
| Immigrants | Armenia | 0.0 /100 | #347 | Tragic 4.2% |
Demographics Similar to Sudanese by Self-Care Disability
In terms of self-care disability, the demographic groups most similar to Sudanese are Immigrants from South Central Asia (2.2%, a difference of 0.10%), Immigrants from Ethiopia (2.2%, a difference of 0.16%), Ethiopian (2.2%, a difference of 0.17%), Luxembourger (2.2%, a difference of 0.33%), and Okinawan (2.2%, a difference of 0.34%).
| Demographics | Rating | Rank | Self-Care Disability |
| Thais | 100.0 /100 | #3 | Exceptional 2.1% |
| Immigrants | Singapore | 100.0 /100 | #4 | Exceptional 2.1% |
| Zimbabweans | 100.0 /100 | #5 | Exceptional 2.2% |
| Filipinos | 100.0 /100 | #6 | Exceptional 2.2% |
| Immigrants | Bolivia | 100.0 /100 | #7 | Exceptional 2.2% |
| Bolivians | 100.0 /100 | #8 | Exceptional 2.2% |
| Immigrants | Nepal | 100.0 /100 | #9 | Exceptional 2.2% |
| Sudanese | 100.0 /100 | #10 | Exceptional 2.2% |
| Immigrants | South Central Asia | 100.0 /100 | #11 | Exceptional 2.2% |
| Immigrants | Ethiopia | 100.0 /100 | #12 | Exceptional 2.2% |
| Ethiopians | 100.0 /100 | #13 | Exceptional 2.2% |
| Luxembourgers | 100.0 /100 | #14 | Exceptional 2.2% |
| Okinawans | 100.0 /100 | #15 | Exceptional 2.2% |
| Immigrants | Kuwait | 100.0 /100 | #16 | Exceptional 2.2% |
| Immigrants | Saudi Arabia | 100.0 /100 | #17 | Exceptional 2.2% |