Celtic vs Immigrants from Ghana Male Disability
COMPARE
Celtic
Immigrants from Ghana
Male Disability
Male Disability Comparison
Celtics
Immigrants from Ghana
13.0%
MALE DISABILITY
0.0/ 100
METRIC RATING
299th/ 347
METRIC RANK
10.9%
MALE DISABILITY
89.0/ 100
METRIC RATING
122nd/ 347
METRIC RANK
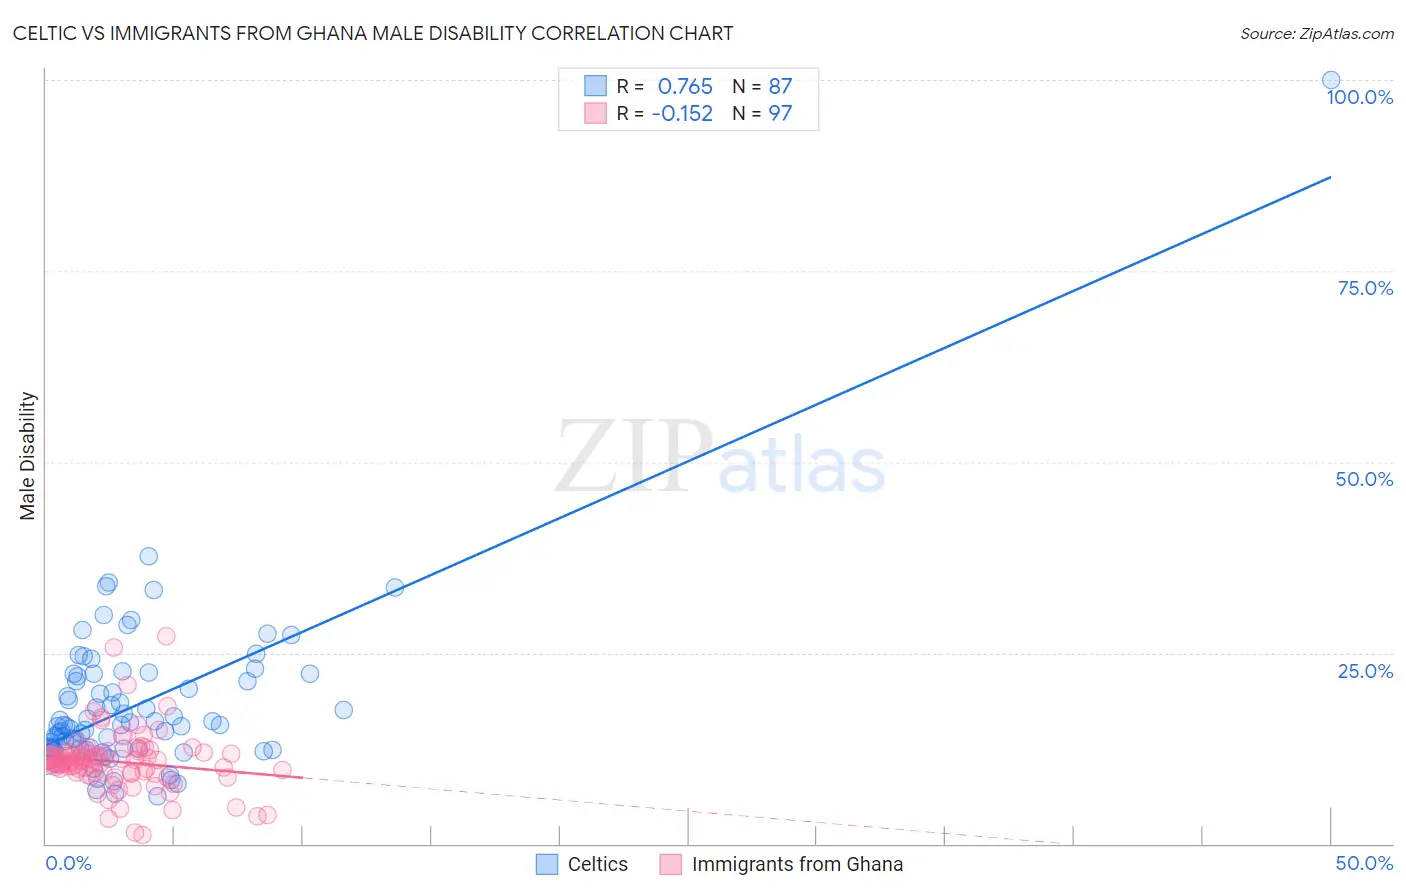
Celtic vs Immigrants from Ghana Male Disability Correlation Chart
The statistical analysis conducted on geographies consisting of 168,867,682 people shows a strong positive correlation between the proportion of Celtics and percentage of males with a disability in the United States with a correlation coefficient (R) of 0.765 and weighted average of 13.0%. Similarly, the statistical analysis conducted on geographies consisting of 199,919,905 people shows a poor negative correlation between the proportion of Immigrants from Ghana and percentage of males with a disability in the United States with a correlation coefficient (R) of -0.152 and weighted average of 10.9%, a difference of 19.6%.
Male Disability Correlation Summary
| Measurement | Celtic | Immigrants from Ghana |
| Minimum | 6.2% | 1.1% |
| Maximum | 100.0% | 27.2% |
| Range | 93.8% | 26.2% |
| Mean | 18.4% | 10.8% |
| Median | 15.5% | 10.8% |
| Interquartile 25% (IQ1) | 12.5% | 9.3% |
| Interquartile 75% (IQ3) | 22.2% | 11.9% |
| Interquartile Range (IQR) | 9.7% | 2.6% |
| Standard Deviation (Sample) | 11.2% | 3.9% |
| Standard Deviation (Population) | 11.2% | 3.9% |
Similar Demographics by Male Disability
Demographics Similar to Celtics by Male Disability
In terms of male disability, the demographic groups most similar to Celtics are Cheyenne (13.0%, a difference of 0.090%), French (13.0%, a difference of 0.13%), Pennsylvania German (13.0%, a difference of 0.35%), Inupiat (13.0%, a difference of 0.55%), and Nonimmigrants (12.9%, a difference of 0.66%).
| Demographics | Rating | Rank | Male Disability |
| English | 0.0 /100 | #292 | Tragic 12.8% |
| Yaqui | 0.0 /100 | #293 | Tragic 12.9% |
| Marshallese | 0.0 /100 | #294 | Tragic 12.9% |
| Immigrants | Micronesia | 0.0 /100 | #295 | Tragic 12.9% |
| Immigrants | Nonimmigrants | 0.0 /100 | #296 | Tragic 12.9% |
| Inupiat | 0.0 /100 | #297 | Tragic 13.0% |
| Pennsylvania Germans | 0.0 /100 | #298 | Tragic 13.0% |
| Celtics | 0.0 /100 | #299 | Tragic 13.0% |
| Cheyenne | 0.0 /100 | #300 | Tragic 13.0% |
| French | 0.0 /100 | #301 | Tragic 13.0% |
| Crow | 0.0 /100 | #302 | Tragic 13.1% |
| Scotch-Irish | 0.0 /100 | #303 | Tragic 13.2% |
| Blacks/African Americans | 0.0 /100 | #304 | Tragic 13.2% |
| French Canadians | 0.0 /100 | #305 | Tragic 13.3% |
| Spanish Americans | 0.0 /100 | #306 | Tragic 13.3% |
Demographics Similar to Immigrants from Ghana by Male Disability
In terms of male disability, the demographic groups most similar to Immigrants from Ghana are Immigrants from South Eastern Asia (10.9%, a difference of 0.010%), Immigrants from Africa (10.9%, a difference of 0.060%), Immigrants from Czechoslovakia (10.9%, a difference of 0.090%), South American Indian (10.9%, a difference of 0.14%), and Immigrants from North Macedonia (10.9%, a difference of 0.14%).
| Demographics | Rating | Rank | Male Disability |
| Immigrants | Barbados | 92.2 /100 | #115 | Exceptional 10.8% |
| Immigrants | South Africa | 91.8 /100 | #116 | Exceptional 10.8% |
| Eastern Europeans | 90.6 /100 | #117 | Exceptional 10.9% |
| Immigrants | Cuba | 90.2 /100 | #118 | Exceptional 10.9% |
| Armenians | 90.1 /100 | #119 | Exceptional 10.9% |
| Immigrants | Africa | 89.4 /100 | #120 | Excellent 10.9% |
| Immigrants | South Eastern Asia | 89.2 /100 | #121 | Excellent 10.9% |
| Immigrants | Ghana | 89.0 /100 | #122 | Excellent 10.9% |
| Immigrants | Czechoslovakia | 88.4 /100 | #123 | Excellent 10.9% |
| South American Indians | 88.1 /100 | #124 | Excellent 10.9% |
| Immigrants | North Macedonia | 88.1 /100 | #125 | Excellent 10.9% |
| Immigrants | Trinidad and Tobago | 86.9 /100 | #126 | Excellent 10.9% |
| Immigrants | Ukraine | 86.8 /100 | #127 | Excellent 10.9% |
| Immigrants | Latvia | 85.5 /100 | #128 | Excellent 10.9% |
| Immigrants | Philippines | 85.4 /100 | #129 | Excellent 10.9% |