Celtic vs Lithuanian Male Disability
COMPARE
Celtic
Lithuanian
Male Disability
Male Disability Comparison
Celtics
Lithuanians
13.0%
MALE DISABILITY
0.0/ 100
METRIC RATING
299th/ 347
METRIC RANK
11.6%
MALE DISABILITY
6.6/ 100
METRIC RATING
214th/ 347
METRIC RANK
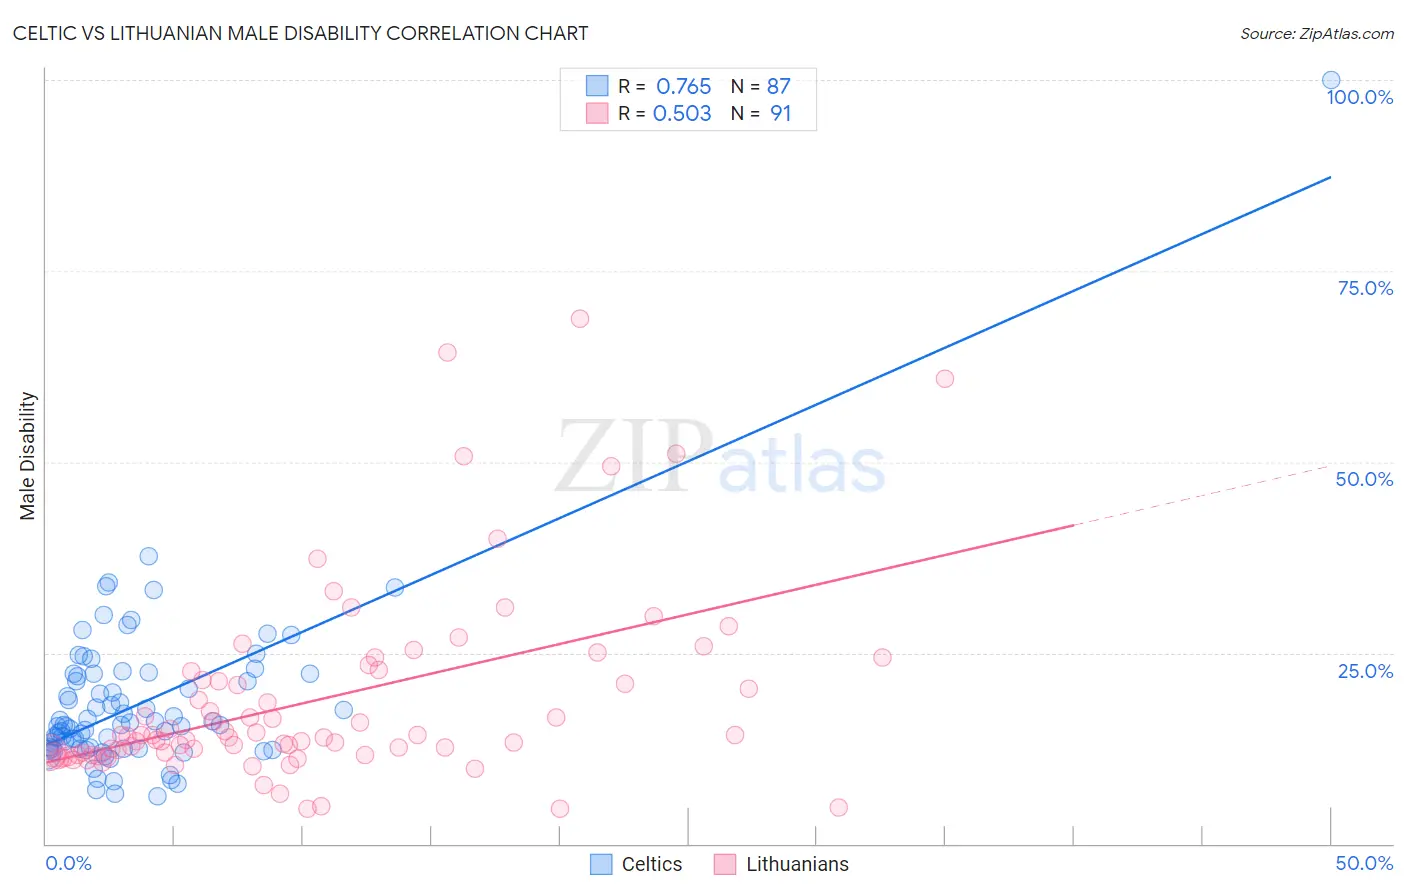
Celtic vs Lithuanian Male Disability Correlation Chart
The statistical analysis conducted on geographies consisting of 168,867,682 people shows a strong positive correlation between the proportion of Celtics and percentage of males with a disability in the United States with a correlation coefficient (R) of 0.765 and weighted average of 13.0%. Similarly, the statistical analysis conducted on geographies consisting of 421,914,182 people shows a substantial positive correlation between the proportion of Lithuanians and percentage of males with a disability in the United States with a correlation coefficient (R) of 0.503 and weighted average of 11.6%, a difference of 12.0%.
Male Disability Correlation Summary
| Measurement | Celtic | Lithuanian |
| Minimum | 6.2% | 4.5% |
| Maximum | 100.0% | 68.7% |
| Range | 93.8% | 64.1% |
| Mean | 18.4% | 18.8% |
| Median | 15.5% | 14.1% |
| Interquartile 25% (IQ1) | 12.5% | 11.6% |
| Interquartile 75% (IQ3) | 22.2% | 22.5% |
| Interquartile Range (IQR) | 9.7% | 10.9% |
| Standard Deviation (Sample) | 11.2% | 12.6% |
| Standard Deviation (Population) | 11.2% | 12.5% |
Similar Demographics by Male Disability
Demographics Similar to Celtics by Male Disability
In terms of male disability, the demographic groups most similar to Celtics are Cheyenne (13.0%, a difference of 0.090%), French (13.0%, a difference of 0.13%), Pennsylvania German (13.0%, a difference of 0.35%), Inupiat (13.0%, a difference of 0.55%), and Nonimmigrants (12.9%, a difference of 0.66%).
| Demographics | Rating | Rank | Male Disability |
| English | 0.0 /100 | #292 | Tragic 12.8% |
| Yaqui | 0.0 /100 | #293 | Tragic 12.9% |
| Marshallese | 0.0 /100 | #294 | Tragic 12.9% |
| Immigrants | Micronesia | 0.0 /100 | #295 | Tragic 12.9% |
| Immigrants | Nonimmigrants | 0.0 /100 | #296 | Tragic 12.9% |
| Inupiat | 0.0 /100 | #297 | Tragic 13.0% |
| Pennsylvania Germans | 0.0 /100 | #298 | Tragic 13.0% |
| Celtics | 0.0 /100 | #299 | Tragic 13.0% |
| Cheyenne | 0.0 /100 | #300 | Tragic 13.0% |
| French | 0.0 /100 | #301 | Tragic 13.0% |
| Crow | 0.0 /100 | #302 | Tragic 13.1% |
| Scotch-Irish | 0.0 /100 | #303 | Tragic 13.2% |
| Blacks/African Americans | 0.0 /100 | #304 | Tragic 13.2% |
| French Canadians | 0.0 /100 | #305 | Tragic 13.3% |
| Spanish Americans | 0.0 /100 | #306 | Tragic 13.3% |
Demographics Similar to Lithuanians by Male Disability
In terms of male disability, the demographic groups most similar to Lithuanians are Indonesian (11.6%, a difference of 0.16%), Mexican American Indian (11.6%, a difference of 0.24%), Immigrants from Scotland (11.6%, a difference of 0.32%), Immigrants from Thailand (11.6%, a difference of 0.35%), and Immigrants from Dominican Republic (11.7%, a difference of 0.44%).
| Demographics | Rating | Rank | Male Disability |
| Immigrants | Somalia | 10.4 /100 | #207 | Poor 11.5% |
| Icelanders | 10.1 /100 | #208 | Poor 11.6% |
| Spanish American Indians | 10.1 /100 | #209 | Poor 11.6% |
| Ute | 9.4 /100 | #210 | Tragic 11.6% |
| Immigrants | Thailand | 8.4 /100 | #211 | Tragic 11.6% |
| Immigrants | Scotland | 8.2 /100 | #212 | Tragic 11.6% |
| Mexican American Indians | 7.8 /100 | #213 | Tragic 11.6% |
| Lithuanians | 6.6 /100 | #214 | Tragic 11.6% |
| Indonesians | 5.9 /100 | #215 | Tragic 11.6% |
| Immigrants | Dominican Republic | 4.9 /100 | #216 | Tragic 11.7% |
| Immigrants | Dominica | 4.6 /100 | #217 | Tragic 11.7% |
| Immigrants | England | 4.0 /100 | #218 | Tragic 11.7% |
| Panamanians | 3.8 /100 | #219 | Tragic 11.7% |
| Immigrants | Western Europe | 3.8 /100 | #220 | Tragic 11.7% |
| Immigrants | Congo | 3.7 /100 | #221 | Tragic 11.7% |