Celtic vs Houma Male Disability
COMPARE
Celtic
Houma
Male Disability
Male Disability Comparison
Celtics
Houma
13.0%
MALE DISABILITY
0.0/ 100
METRIC RATING
299th/ 347
METRIC RANK
17.4%
MALE DISABILITY
0.0/ 100
METRIC RATING
347th/ 347
METRIC RANK
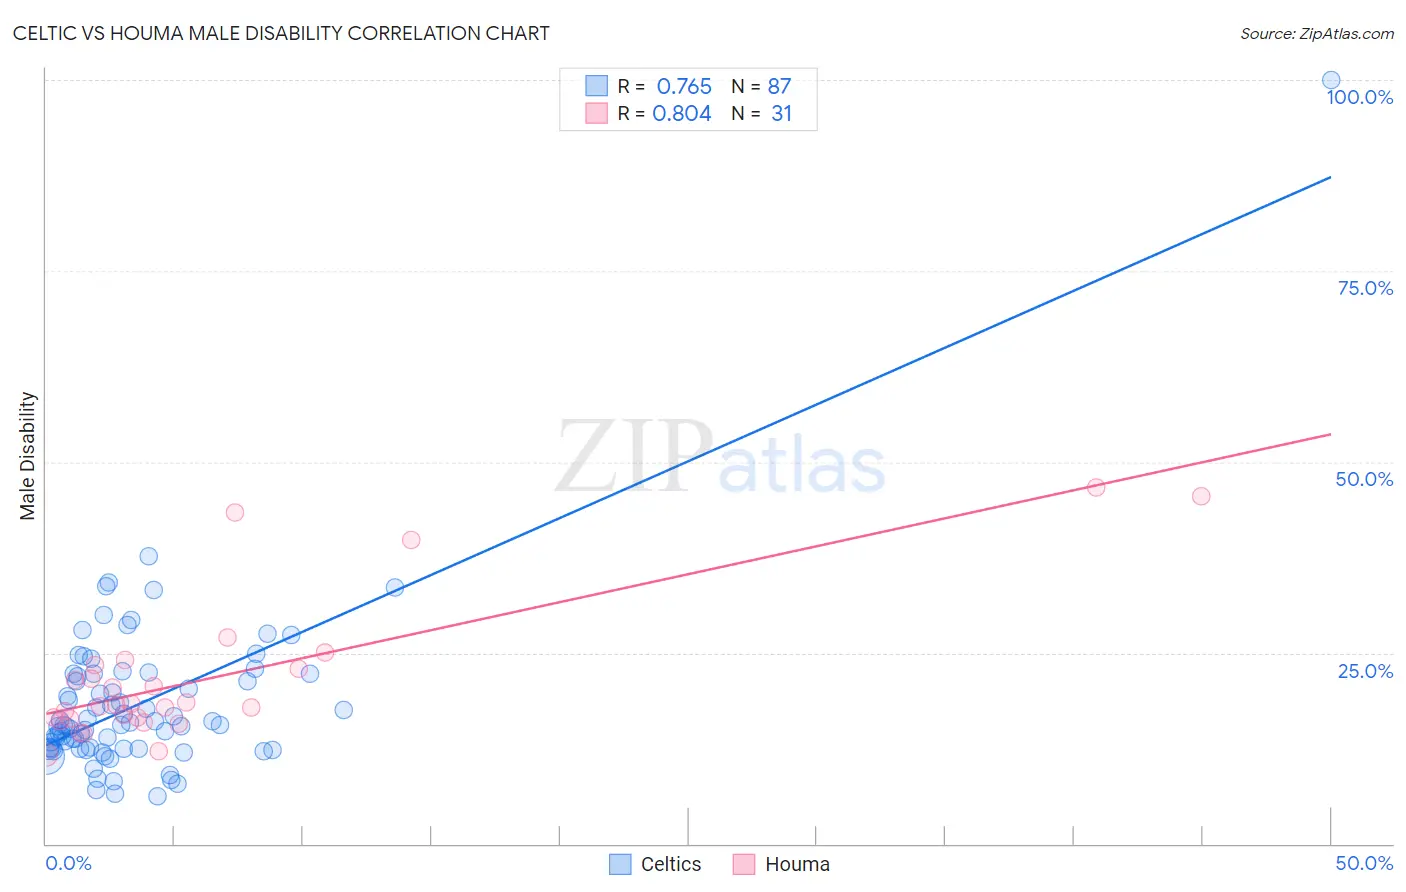
Celtic vs Houma Male Disability Correlation Chart
The statistical analysis conducted on geographies consisting of 168,867,682 people shows a strong positive correlation between the proportion of Celtics and percentage of males with a disability in the United States with a correlation coefficient (R) of 0.765 and weighted average of 13.0%. Similarly, the statistical analysis conducted on geographies consisting of 36,793,255 people shows a very strong positive correlation between the proportion of Houma and percentage of males with a disability in the United States with a correlation coefficient (R) of 0.804 and weighted average of 17.4%, a difference of 33.9%.
Male Disability Correlation Summary
| Measurement | Celtic | Houma |
| Minimum | 6.2% | 11.6% |
| Maximum | 100.0% | 46.6% |
| Range | 93.8% | 35.0% |
| Mean | 18.4% | 21.8% |
| Median | 15.5% | 18.2% |
| Interquartile 25% (IQ1) | 12.5% | 16.4% |
| Interquartile 75% (IQ3) | 22.2% | 23.5% |
| Interquartile Range (IQR) | 9.7% | 7.1% |
| Standard Deviation (Sample) | 11.2% | 9.4% |
| Standard Deviation (Population) | 11.2% | 9.2% |
Similar Demographics by Male Disability
Demographics Similar to Celtics by Male Disability
In terms of male disability, the demographic groups most similar to Celtics are Cheyenne (13.0%, a difference of 0.090%), French (13.0%, a difference of 0.13%), Pennsylvania German (13.0%, a difference of 0.35%), Inupiat (13.0%, a difference of 0.55%), and Nonimmigrants (12.9%, a difference of 0.66%).
| Demographics | Rating | Rank | Male Disability |
| English | 0.0 /100 | #292 | Tragic 12.8% |
| Yaqui | 0.0 /100 | #293 | Tragic 12.9% |
| Marshallese | 0.0 /100 | #294 | Tragic 12.9% |
| Immigrants | Micronesia | 0.0 /100 | #295 | Tragic 12.9% |
| Immigrants | Nonimmigrants | 0.0 /100 | #296 | Tragic 12.9% |
| Inupiat | 0.0 /100 | #297 | Tragic 13.0% |
| Pennsylvania Germans | 0.0 /100 | #298 | Tragic 13.0% |
| Celtics | 0.0 /100 | #299 | Tragic 13.0% |
| Cheyenne | 0.0 /100 | #300 | Tragic 13.0% |
| French | 0.0 /100 | #301 | Tragic 13.0% |
| Crow | 0.0 /100 | #302 | Tragic 13.1% |
| Scotch-Irish | 0.0 /100 | #303 | Tragic 13.2% |
| Blacks/African Americans | 0.0 /100 | #304 | Tragic 13.2% |
| French Canadians | 0.0 /100 | #305 | Tragic 13.3% |
| Spanish Americans | 0.0 /100 | #306 | Tragic 13.3% |
Demographics Similar to Houma by Male Disability
In terms of male disability, the demographic groups most similar to Houma are Colville (16.5%, a difference of 5.7%), Tsimshian (15.6%, a difference of 11.8%), Puerto Rican (15.6%, a difference of 12.1%), Creek (15.5%, a difference of 12.3%), and Kiowa (15.4%, a difference of 13.0%).
| Demographics | Rating | Rank | Male Disability |
| Yuman | 0.0 /100 | #333 | Tragic 14.7% |
| Cherokee | 0.0 /100 | #334 | Tragic 14.8% |
| Dutch West Indians | 0.0 /100 | #335 | Tragic 14.8% |
| Alaskan Athabascans | 0.0 /100 | #336 | Tragic 14.9% |
| Menominee | 0.0 /100 | #337 | Tragic 15.0% |
| Pueblo | 0.0 /100 | #338 | Tragic 15.0% |
| Chickasaw | 0.0 /100 | #339 | Tragic 15.1% |
| Lumbee | 0.0 /100 | #340 | Tragic 15.2% |
| Choctaw | 0.0 /100 | #341 | Tragic 15.4% |
| Kiowa | 0.0 /100 | #342 | Tragic 15.4% |
| Creek | 0.0 /100 | #343 | Tragic 15.5% |
| Puerto Ricans | 0.0 /100 | #344 | Tragic 15.6% |
| Tsimshian | 0.0 /100 | #345 | Tragic 15.6% |
| Colville | 0.0 /100 | #346 | Tragic 16.5% |
| Houma | 0.0 /100 | #347 | Tragic 17.4% |