Bahamian vs Immigrants from Ghana Male Disability
COMPARE
Bahamian
Immigrants from Ghana
Male Disability
Male Disability Comparison
Bahamians
Immigrants from Ghana
11.9%
MALE DISABILITY
1.1/ 100
METRIC RATING
241st/ 347
METRIC RANK
10.9%
MALE DISABILITY
89.0/ 100
METRIC RATING
122nd/ 347
METRIC RANK
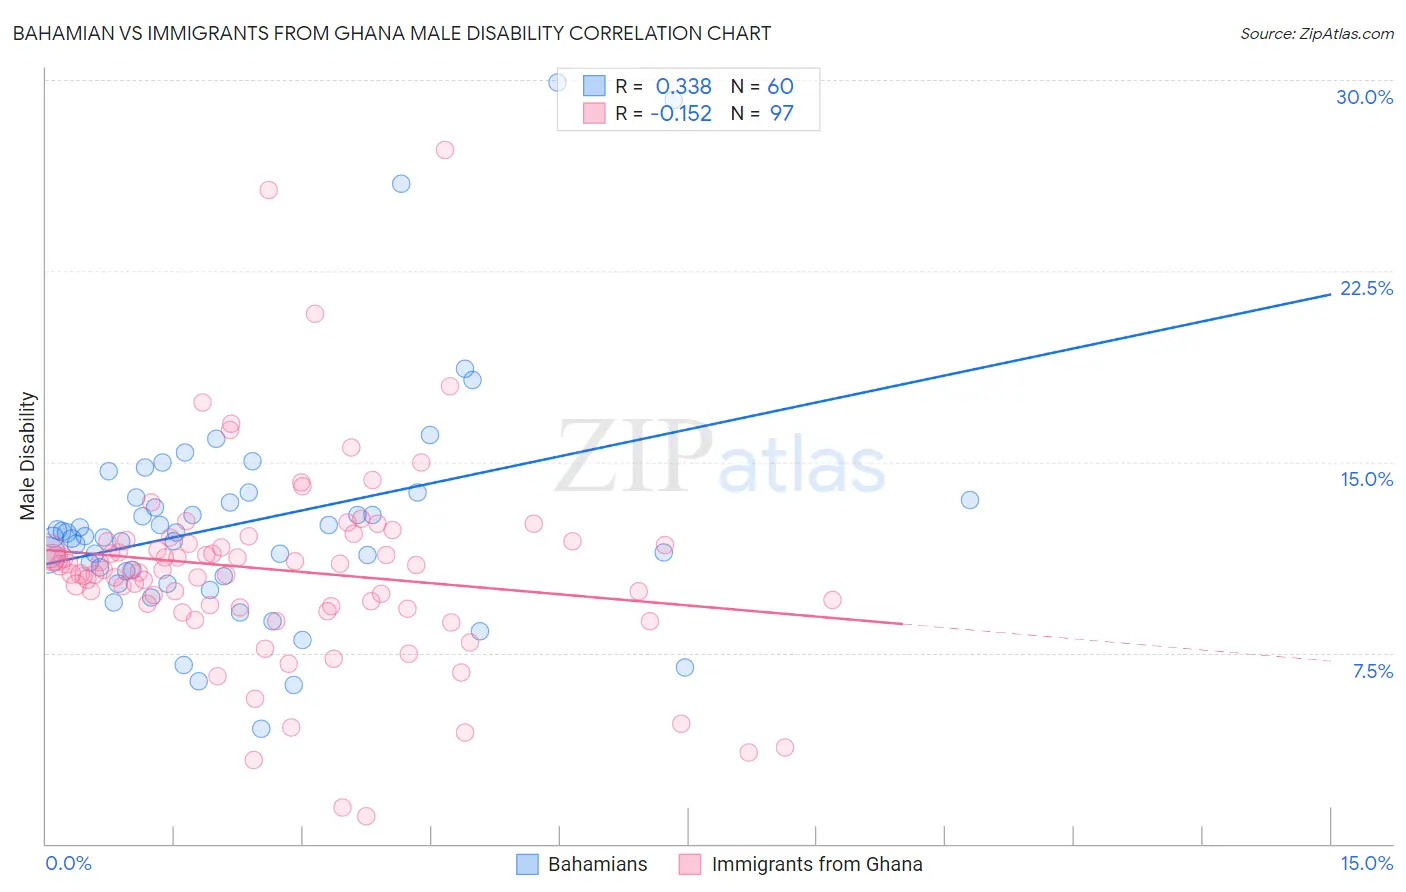
Bahamian vs Immigrants from Ghana Male Disability Correlation Chart
The statistical analysis conducted on geographies consisting of 112,681,735 people shows a mild positive correlation between the proportion of Bahamians and percentage of males with a disability in the United States with a correlation coefficient (R) of 0.338 and weighted average of 11.9%. Similarly, the statistical analysis conducted on geographies consisting of 199,919,905 people shows a poor negative correlation between the proportion of Immigrants from Ghana and percentage of males with a disability in the United States with a correlation coefficient (R) of -0.152 and weighted average of 10.9%, a difference of 9.4%.
Male Disability Correlation Summary
| Measurement | Bahamian | Immigrants from Ghana |
| Minimum | 4.5% | 1.1% |
| Maximum | 29.9% | 27.2% |
| Range | 25.4% | 26.2% |
| Mean | 12.6% | 10.8% |
| Median | 12.1% | 10.8% |
| Interquartile 25% (IQ1) | 10.6% | 9.3% |
| Interquartile 75% (IQ3) | 13.5% | 11.9% |
| Interquartile Range (IQR) | 2.9% | 2.6% |
| Standard Deviation (Sample) | 4.5% | 3.9% |
| Standard Deviation (Population) | 4.5% | 3.9% |
Similar Demographics by Male Disability
Demographics Similar to Bahamians by Male Disability
In terms of male disability, the demographic groups most similar to Bahamians are Northern European (11.9%, a difference of 0.010%), Czech (11.9%, a difference of 0.040%), Samoan (11.9%, a difference of 0.040%), Italian (11.9%, a difference of 0.080%), and Yugoslavian (11.9%, a difference of 0.14%).
| Demographics | Rating | Rank | Male Disability |
| Immigrants | Canada | 1.6 /100 | #234 | Tragic 11.9% |
| Immigrants | North America | 1.5 /100 | #235 | Tragic 11.9% |
| U.S. Virgin Islanders | 1.3 /100 | #236 | Tragic 11.9% |
| Carpatho Rusyns | 1.3 /100 | #237 | Tragic 11.9% |
| Yugoslavians | 1.2 /100 | #238 | Tragic 11.9% |
| Italians | 1.2 /100 | #239 | Tragic 11.9% |
| Czechs | 1.1 /100 | #240 | Tragic 11.9% |
| Bahamians | 1.1 /100 | #241 | Tragic 11.9% |
| Northern Europeans | 1.1 /100 | #242 | Tragic 11.9% |
| Samoans | 1.1 /100 | #243 | Tragic 11.9% |
| Immigrants | Laos | 1.0 /100 | #244 | Tragic 11.9% |
| Immigrants | Liberia | 1.0 /100 | #245 | Tragic 11.9% |
| Danes | 0.9 /100 | #246 | Tragic 11.9% |
| Hungarians | 0.8 /100 | #247 | Tragic 12.0% |
| Poles | 0.7 /100 | #248 | Tragic 12.0% |
Demographics Similar to Immigrants from Ghana by Male Disability
In terms of male disability, the demographic groups most similar to Immigrants from Ghana are Immigrants from South Eastern Asia (10.9%, a difference of 0.010%), Immigrants from Africa (10.9%, a difference of 0.060%), Immigrants from Czechoslovakia (10.9%, a difference of 0.090%), South American Indian (10.9%, a difference of 0.14%), and Immigrants from North Macedonia (10.9%, a difference of 0.14%).
| Demographics | Rating | Rank | Male Disability |
| Immigrants | Barbados | 92.2 /100 | #115 | Exceptional 10.8% |
| Immigrants | South Africa | 91.8 /100 | #116 | Exceptional 10.8% |
| Eastern Europeans | 90.6 /100 | #117 | Exceptional 10.9% |
| Immigrants | Cuba | 90.2 /100 | #118 | Exceptional 10.9% |
| Armenians | 90.1 /100 | #119 | Exceptional 10.9% |
| Immigrants | Africa | 89.4 /100 | #120 | Excellent 10.9% |
| Immigrants | South Eastern Asia | 89.2 /100 | #121 | Excellent 10.9% |
| Immigrants | Ghana | 89.0 /100 | #122 | Excellent 10.9% |
| Immigrants | Czechoslovakia | 88.4 /100 | #123 | Excellent 10.9% |
| South American Indians | 88.1 /100 | #124 | Excellent 10.9% |
| Immigrants | North Macedonia | 88.1 /100 | #125 | Excellent 10.9% |
| Immigrants | Trinidad and Tobago | 86.9 /100 | #126 | Excellent 10.9% |
| Immigrants | Ukraine | 86.8 /100 | #127 | Excellent 10.9% |
| Immigrants | Latvia | 85.5 /100 | #128 | Excellent 10.9% |
| Immigrants | Philippines | 85.4 /100 | #129 | Excellent 10.9% |