Celtic vs Immigrants from Bulgaria Male Disability
COMPARE
Celtic
Immigrants from Bulgaria
Male Disability
Male Disability Comparison
Celtics
Immigrants from Bulgaria
13.0%
MALE DISABILITY
0.0/ 100
METRIC RATING
299th/ 347
METRIC RANK
10.5%
MALE DISABILITY
99.1/ 100
METRIC RATING
70th/ 347
METRIC RANK
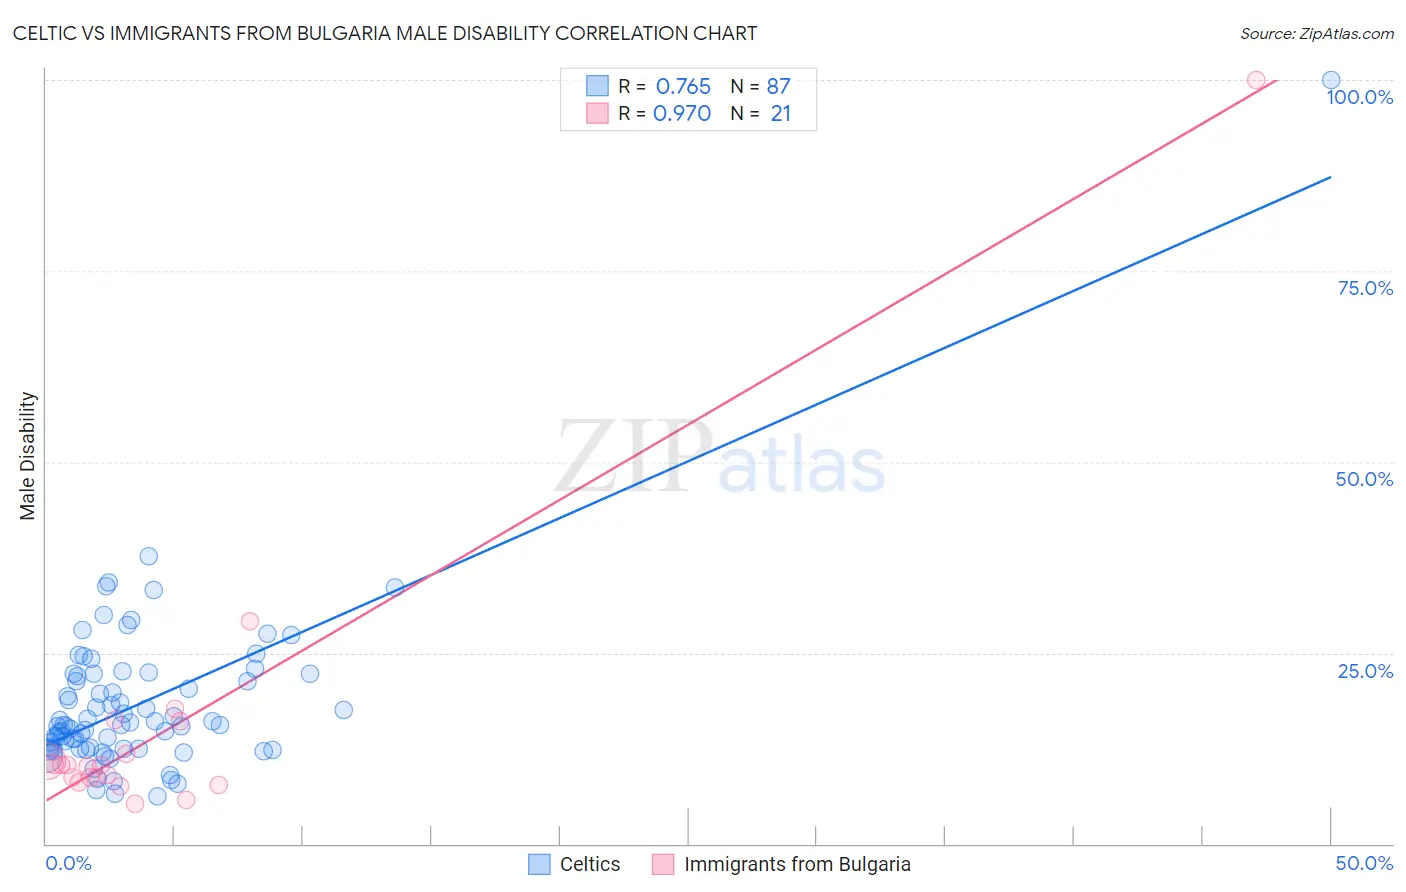
Celtic vs Immigrants from Bulgaria Male Disability Correlation Chart
The statistical analysis conducted on geographies consisting of 168,867,682 people shows a strong positive correlation between the proportion of Celtics and percentage of males with a disability in the United States with a correlation coefficient (R) of 0.765 and weighted average of 13.0%. Similarly, the statistical analysis conducted on geographies consisting of 172,550,350 people shows a perfect positive correlation between the proportion of Immigrants from Bulgaria and percentage of males with a disability in the United States with a correlation coefficient (R) of 0.970 and weighted average of 10.5%, a difference of 24.2%.
Male Disability Correlation Summary
| Measurement | Celtic | Immigrants from Bulgaria |
| Minimum | 6.2% | 5.2% |
| Maximum | 100.0% | 100.0% |
| Range | 93.8% | 94.8% |
| Mean | 18.4% | 15.4% |
| Median | 15.5% | 10.3% |
| Interquartile 25% (IQ1) | 12.5% | 8.3% |
| Interquartile 75% (IQ3) | 22.2% | 14.0% |
| Interquartile Range (IQR) | 9.7% | 5.7% |
| Standard Deviation (Sample) | 11.2% | 20.1% |
| Standard Deviation (Population) | 11.2% | 19.6% |
Similar Demographics by Male Disability
Demographics Similar to Celtics by Male Disability
In terms of male disability, the demographic groups most similar to Celtics are Cheyenne (13.0%, a difference of 0.090%), French (13.0%, a difference of 0.13%), Pennsylvania German (13.0%, a difference of 0.35%), Inupiat (13.0%, a difference of 0.55%), and Nonimmigrants (12.9%, a difference of 0.66%).
| Demographics | Rating | Rank | Male Disability |
| English | 0.0 /100 | #292 | Tragic 12.8% |
| Yaqui | 0.0 /100 | #293 | Tragic 12.9% |
| Marshallese | 0.0 /100 | #294 | Tragic 12.9% |
| Immigrants | Micronesia | 0.0 /100 | #295 | Tragic 12.9% |
| Immigrants | Nonimmigrants | 0.0 /100 | #296 | Tragic 12.9% |
| Inupiat | 0.0 /100 | #297 | Tragic 13.0% |
| Pennsylvania Germans | 0.0 /100 | #298 | Tragic 13.0% |
| Celtics | 0.0 /100 | #299 | Tragic 13.0% |
| Cheyenne | 0.0 /100 | #300 | Tragic 13.0% |
| French | 0.0 /100 | #301 | Tragic 13.0% |
| Crow | 0.0 /100 | #302 | Tragic 13.1% |
| Scotch-Irish | 0.0 /100 | #303 | Tragic 13.2% |
| Blacks/African Americans | 0.0 /100 | #304 | Tragic 13.2% |
| French Canadians | 0.0 /100 | #305 | Tragic 13.3% |
| Spanish Americans | 0.0 /100 | #306 | Tragic 13.3% |
Demographics Similar to Immigrants from Bulgaria by Male Disability
In terms of male disability, the demographic groups most similar to Immigrants from Bulgaria are Colombian (10.5%, a difference of 0.14%), Ecuadorian (10.5%, a difference of 0.14%), Immigrants from Cameroon (10.5%, a difference of 0.15%), Immigrants from Serbia (10.5%, a difference of 0.20%), and Immigrants from Afghanistan (10.5%, a difference of 0.24%).
| Demographics | Rating | Rank | Male Disability |
| Immigrants | Belarus | 99.3 /100 | #63 | Exceptional 10.4% |
| Jordanians | 99.3 /100 | #64 | Exceptional 10.5% |
| Immigrants | Grenada | 99.2 /100 | #65 | Exceptional 10.5% |
| Guyanese | 99.2 /100 | #66 | Exceptional 10.5% |
| Immigrants | Afghanistan | 99.2 /100 | #67 | Exceptional 10.5% |
| Colombians | 99.2 /100 | #68 | Exceptional 10.5% |
| Ecuadorians | 99.2 /100 | #69 | Exceptional 10.5% |
| Immigrants | Bulgaria | 99.1 /100 | #70 | Exceptional 10.5% |
| Immigrants | Cameroon | 99.0 /100 | #71 | Exceptional 10.5% |
| Immigrants | Serbia | 99.0 /100 | #72 | Exceptional 10.5% |
| Immigrants | Lithuania | 98.9 /100 | #73 | Exceptional 10.5% |
| Immigrants | Lebanon | 98.8 /100 | #74 | Exceptional 10.5% |
| Sierra Leoneans | 98.7 /100 | #75 | Exceptional 10.5% |
| Immigrants | Sierra Leone | 98.7 /100 | #76 | Exceptional 10.5% |
| Laotians | 98.6 /100 | #77 | Exceptional 10.6% |