Celtic vs Immigrants from Ghana Child Poverty Among Boys Under 16
COMPARE
Celtic
Immigrants from Ghana
Child Poverty Among Boys Under 16
Child Poverty Among Boys Under 16 Comparison
Celtics
Immigrants from Ghana
16.6%
CHILD POVERTY AMONG BOYS UNDER 16
40.6/ 100
METRIC RATING
184th/ 347
METRIC RANK
19.4%
CHILD POVERTY AMONG BOYS UNDER 16
0.2/ 100
METRIC RATING
261st/ 347
METRIC RANK
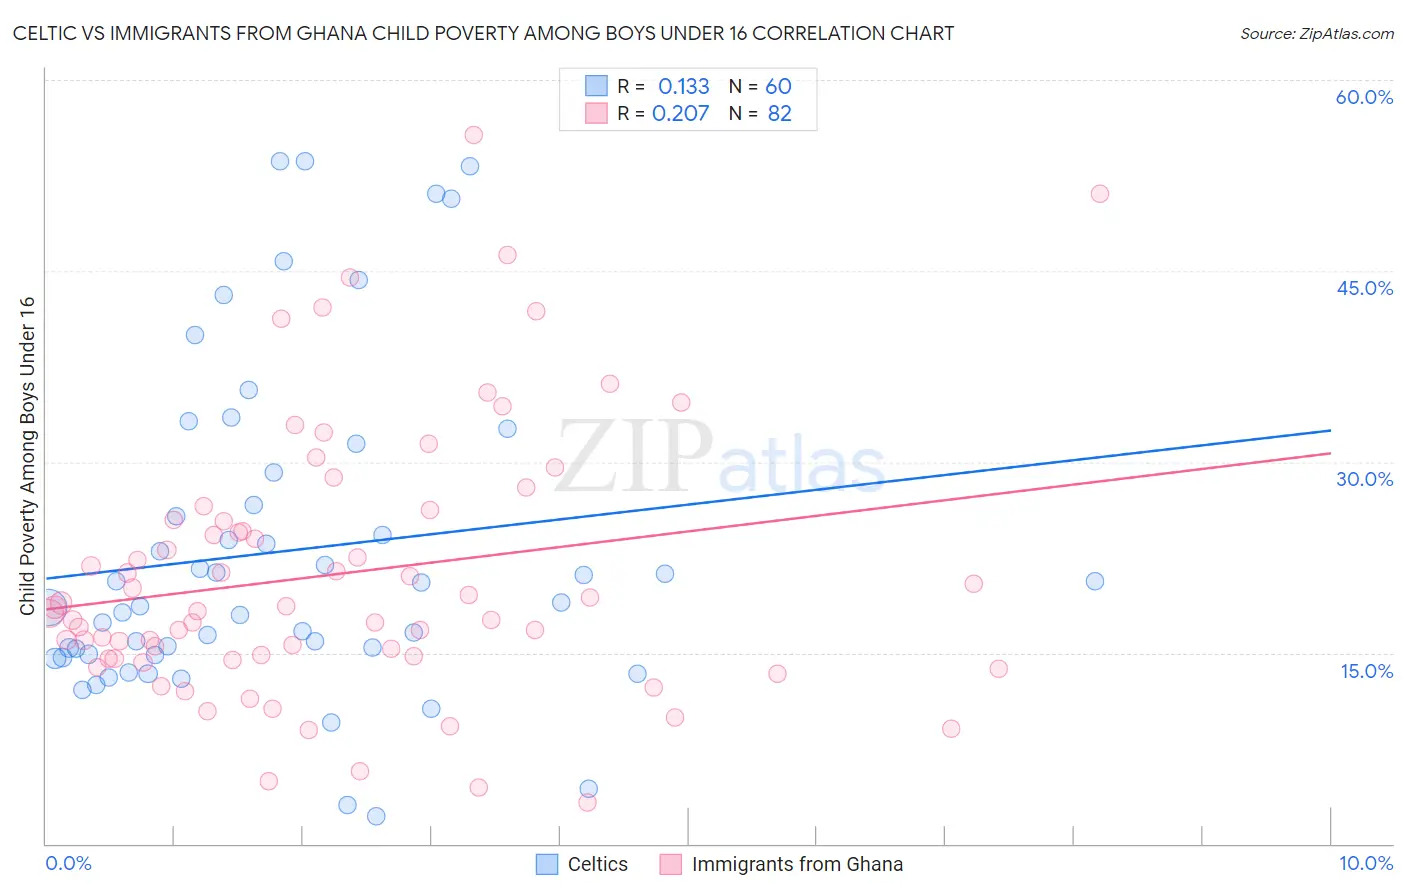
Celtic vs Immigrants from Ghana Child Poverty Among Boys Under 16 Correlation Chart
The statistical analysis conducted on geographies consisting of 167,451,982 people shows a poor positive correlation between the proportion of Celtics and poverty level among boys under the age of 16 in the United States with a correlation coefficient (R) of 0.133 and weighted average of 16.6%. Similarly, the statistical analysis conducted on geographies consisting of 198,440,109 people shows a weak positive correlation between the proportion of Immigrants from Ghana and poverty level among boys under the age of 16 in the United States with a correlation coefficient (R) of 0.207 and weighted average of 19.4%, a difference of 16.8%.
Child Poverty Among Boys Under 16 Correlation Summary
| Measurement | Celtic | Immigrants from Ghana |
| Minimum | 2.2% | 3.2% |
| Maximum | 53.6% | 55.7% |
| Range | 51.4% | 52.4% |
| Mean | 23.0% | 21.2% |
| Median | 18.8% | 18.4% |
| Interquartile 25% (IQ1) | 14.8% | 14.6% |
| Interquartile 75% (IQ3) | 27.9% | 25.4% |
| Interquartile Range (IQR) | 13.0% | 10.8% |
| Standard Deviation (Sample) | 12.8% | 10.6% |
| Standard Deviation (Population) | 12.7% | 10.6% |
Similar Demographics by Child Poverty Among Boys Under 16
Demographics Similar to Celtics by Child Poverty Among Boys Under 16
In terms of child poverty among boys under 16, the demographic groups most similar to Celtics are Immigrants from Western Asia (16.6%, a difference of 0.030%), Kenyan (16.6%, a difference of 0.040%), Hmong (16.6%, a difference of 0.25%), Lebanese (16.6%, a difference of 0.30%), and Immigrants from Costa Rica (16.7%, a difference of 0.33%).
| Demographics | Rating | Rank | Child Poverty Among Boys Under 16 |
| Ethiopians | 47.8 /100 | #177 | Average 16.5% |
| Scotch-Irish | 47.5 /100 | #178 | Average 16.5% |
| Hungarians | 47.3 /100 | #179 | Average 16.5% |
| Hawaiians | 45.5 /100 | #180 | Average 16.5% |
| South American Indians | 44.3 /100 | #181 | Average 16.5% |
| Lebanese | 43.3 /100 | #182 | Average 16.6% |
| Kenyans | 41.0 /100 | #183 | Average 16.6% |
| Celtics | 40.6 /100 | #184 | Average 16.6% |
| Immigrants | Western Asia | 40.4 /100 | #185 | Average 16.6% |
| Hmong | 38.4 /100 | #186 | Fair 16.6% |
| Immigrants | Costa Rica | 37.8 /100 | #187 | Fair 16.7% |
| Immigrants | South America | 37.7 /100 | #188 | Fair 16.7% |
| Immigrants | Morocco | 34.5 /100 | #189 | Fair 16.7% |
| Arabs | 31.1 /100 | #190 | Fair 16.8% |
| Alaska Natives | 29.8 /100 | #191 | Fair 16.8% |
Demographics Similar to Immigrants from Ghana by Child Poverty Among Boys Under 16
In terms of child poverty among boys under 16, the demographic groups most similar to Immigrants from Ghana are Shoshone (19.4%, a difference of 0.010%), Spanish American (19.4%, a difference of 0.12%), Potawatomi (19.4%, a difference of 0.13%), Mexican American Indian (19.4%, a difference of 0.15%), and Immigrants from Guyana (19.5%, a difference of 0.32%).
| Demographics | Rating | Rank | Child Poverty Among Boys Under 16 |
| Trinidadians and Tobagonians | 0.2 /100 | #254 | Tragic 19.3% |
| Ecuadorians | 0.2 /100 | #255 | Tragic 19.3% |
| Immigrants | Liberia | 0.2 /100 | #256 | Tragic 19.3% |
| Mexican American Indians | 0.2 /100 | #257 | Tragic 19.4% |
| Potawatomi | 0.2 /100 | #258 | Tragic 19.4% |
| Spanish Americans | 0.2 /100 | #259 | Tragic 19.4% |
| Shoshone | 0.2 /100 | #260 | Tragic 19.4% |
| Immigrants | Ghana | 0.2 /100 | #261 | Tragic 19.4% |
| Immigrants | Guyana | 0.1 /100 | #262 | Tragic 19.5% |
| Ottawa | 0.1 /100 | #263 | Tragic 19.5% |
| Iroquois | 0.1 /100 | #264 | Tragic 19.6% |
| Guyanese | 0.1 /100 | #265 | Tragic 19.6% |
| Immigrants | El Salvador | 0.1 /100 | #266 | Tragic 19.6% |
| Vietnamese | 0.1 /100 | #267 | Tragic 19.6% |
| Spanish American Indians | 0.1 /100 | #268 | Tragic 19.6% |