Celtic vs Immigrants from Ghana 9th Grade
COMPARE
Celtic
Immigrants from Ghana
9th Grade
9th Grade Comparison
Celtics
Immigrants from Ghana
96.0%
9TH GRADE
99.9/ 100
METRIC RATING
50th/ 347
METRIC RANK
93.8%
9TH GRADE
0.2/ 100
METRIC RATING
271st/ 347
METRIC RANK
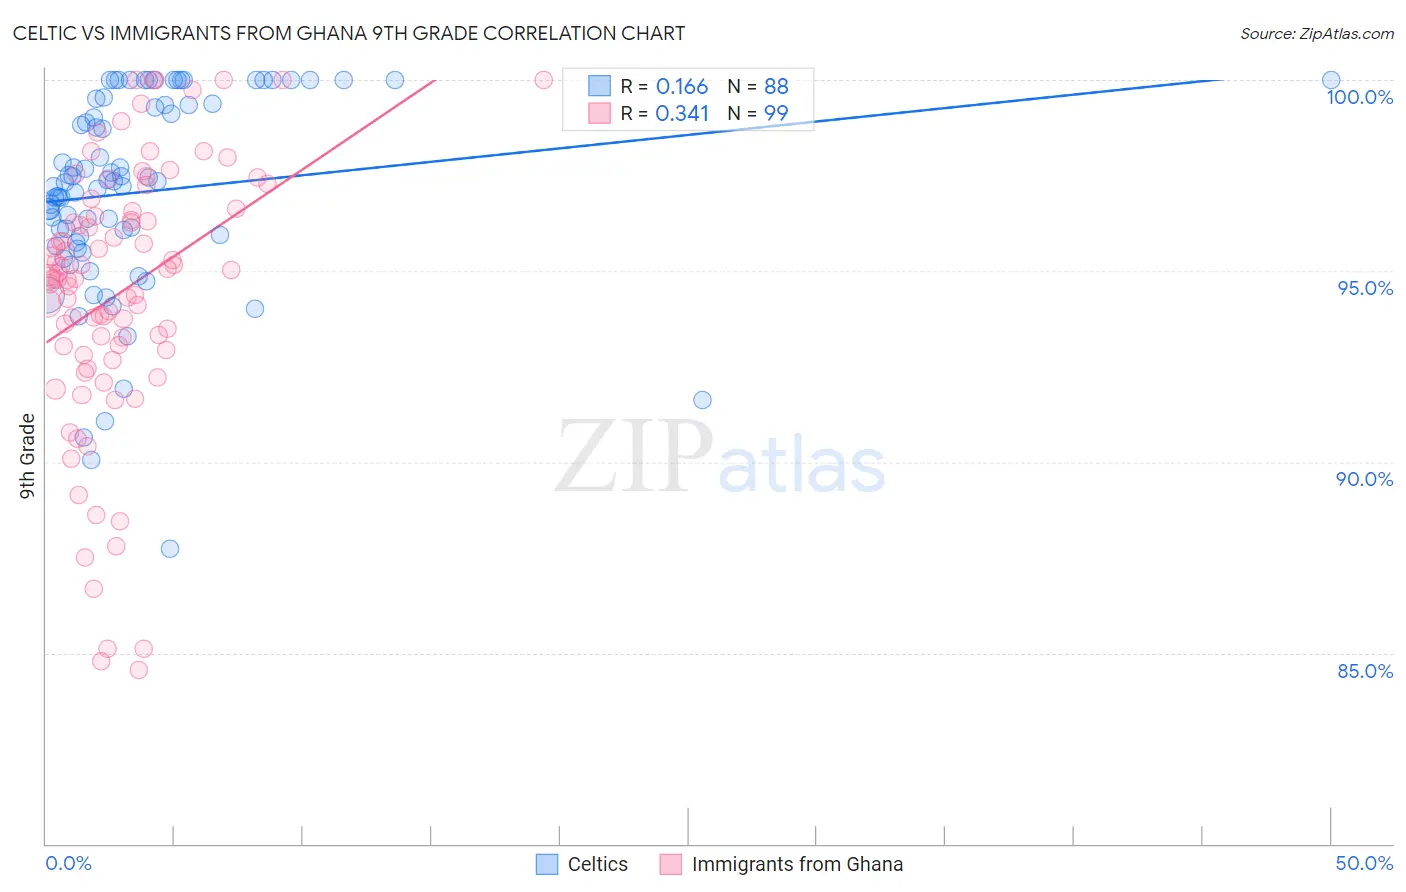
Celtic vs Immigrants from Ghana 9th Grade Correlation Chart
The statistical analysis conducted on geographies consisting of 168,876,981 people shows a poor positive correlation between the proportion of Celtics and percentage of population with at least 9th grade education in the United States with a correlation coefficient (R) of 0.166 and weighted average of 96.0%. Similarly, the statistical analysis conducted on geographies consisting of 199,952,023 people shows a mild positive correlation between the proportion of Immigrants from Ghana and percentage of population with at least 9th grade education in the United States with a correlation coefficient (R) of 0.341 and weighted average of 93.8%, a difference of 2.4%.
9th Grade Correlation Summary
| Measurement | Celtic | Immigrants from Ghana |
| Minimum | 87.7% | 84.5% |
| Maximum | 100.0% | 100.0% |
| Range | 12.3% | 15.5% |
| Mean | 97.1% | 94.4% |
| Median | 97.3% | 94.8% |
| Interquartile 25% (IQ1) | 95.8% | 92.9% |
| Interquartile 75% (IQ3) | 99.4% | 96.6% |
| Interquartile Range (IQR) | 3.5% | 3.6% |
| Standard Deviation (Sample) | 2.6% | 3.5% |
| Standard Deviation (Population) | 2.6% | 3.5% |
Similar Demographics by 9th Grade
Demographics Similar to Celtics by 9th Grade
In terms of 9th grade, the demographic groups most similar to Celtics are Greek (96.0%, a difference of 0.010%), Immigrants from Northern Europe (96.0%, a difference of 0.010%), Russian (96.0%, a difference of 0.020%), Australian (96.0%, a difference of 0.020%), and Serbian (96.0%, a difference of 0.020%).
| Demographics | Rating | Rank | 9th Grade |
| Iranians | 99.9 /100 | #43 | Exceptional 96.1% |
| Alaska Natives | 99.9 /100 | #44 | Exceptional 96.1% |
| Crow | 99.9 /100 | #45 | Exceptional 96.1% |
| Immigrants | India | 99.9 /100 | #46 | Exceptional 96.1% |
| Russians | 99.9 /100 | #47 | Exceptional 96.0% |
| Australians | 99.9 /100 | #48 | Exceptional 96.0% |
| Greeks | 99.9 /100 | #49 | Exceptional 96.0% |
| Celtics | 99.9 /100 | #50 | Exceptional 96.0% |
| Immigrants | Northern Europe | 99.9 /100 | #51 | Exceptional 96.0% |
| Serbians | 99.9 /100 | #52 | Exceptional 96.0% |
| Austrians | 99.8 /100 | #53 | Exceptional 96.0% |
| Immigrants | Canada | 99.8 /100 | #54 | Exceptional 96.0% |
| Immigrants | Austria | 99.8 /100 | #55 | Exceptional 96.0% |
| Immigrants | North America | 99.8 /100 | #56 | Exceptional 96.0% |
| Macedonians | 99.8 /100 | #57 | Exceptional 96.0% |
Demographics Similar to Immigrants from Ghana by 9th Grade
In terms of 9th grade, the demographic groups most similar to Immigrants from Ghana are Immigrants from Western Africa (93.8%, a difference of 0.010%), Yuman (93.8%, a difference of 0.020%), Immigrants from South America (93.8%, a difference of 0.020%), Peruvian (93.8%, a difference of 0.020%), and Immigrants from Uruguay (93.8%, a difference of 0.030%).
| Demographics | Rating | Rank | 9th Grade |
| Immigrants | Congo | 0.4 /100 | #264 | Tragic 93.9% |
| Natives/Alaskans | 0.4 /100 | #265 | Tragic 93.9% |
| Navajo | 0.3 /100 | #266 | Tragic 93.9% |
| Armenians | 0.3 /100 | #267 | Tragic 93.9% |
| Immigrants | Bolivia | 0.3 /100 | #268 | Tragic 93.9% |
| Immigrants | Uruguay | 0.2 /100 | #269 | Tragic 93.8% |
| Yuman | 0.2 /100 | #270 | Tragic 93.8% |
| Immigrants | Ghana | 0.2 /100 | #271 | Tragic 93.8% |
| Immigrants | Western Africa | 0.2 /100 | #272 | Tragic 93.8% |
| Immigrants | South America | 0.2 /100 | #273 | Tragic 93.8% |
| Peruvians | 0.2 /100 | #274 | Tragic 93.8% |
| Immigrants | Colombia | 0.2 /100 | #275 | Tragic 93.8% |
| West Indians | 0.2 /100 | #276 | Tragic 93.7% |
| Immigrants | Philippines | 0.1 /100 | #277 | Tragic 93.7% |
| Immigrants | Eritrea | 0.1 /100 | #278 | Tragic 93.7% |