Immigrants from Europe vs Houma Male Disability
COMPARE
Immigrants from Europe
Houma
Male Disability
Male Disability Comparison
Immigrants from Europe
Houma
11.0%
MALE DISABILITY
82.0/ 100
METRIC RATING
137th/ 347
METRIC RANK
17.4%
MALE DISABILITY
0.0/ 100
METRIC RATING
347th/ 347
METRIC RANK
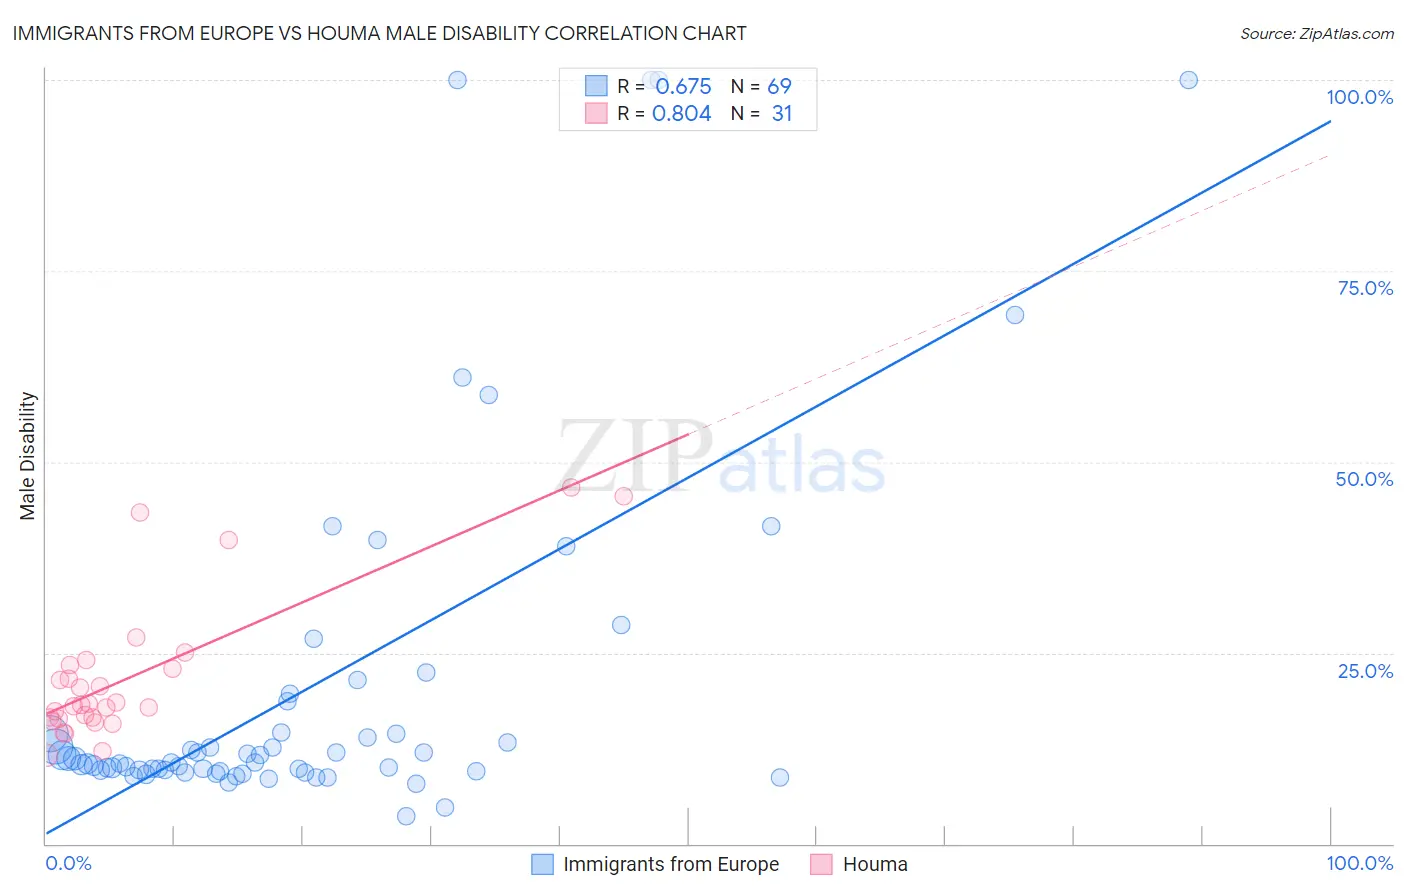
Immigrants from Europe vs Houma Male Disability Correlation Chart
The statistical analysis conducted on geographies consisting of 547,240,570 people shows a significant positive correlation between the proportion of Immigrants from Europe and percentage of males with a disability in the United States with a correlation coefficient (R) of 0.675 and weighted average of 11.0%. Similarly, the statistical analysis conducted on geographies consisting of 36,793,255 people shows a very strong positive correlation between the proportion of Houma and percentage of males with a disability in the United States with a correlation coefficient (R) of 0.804 and weighted average of 17.4%, a difference of 58.8%.
Male Disability Correlation Summary
| Measurement | Immigrants from Europe | Houma |
| Minimum | 3.6% | 11.6% |
| Maximum | 100.0% | 46.6% |
| Range | 96.4% | 35.0% |
| Mean | 20.7% | 21.8% |
| Median | 10.7% | 18.2% |
| Interquartile 25% (IQ1) | 9.6% | 16.4% |
| Interquartile 75% (IQ3) | 16.6% | 23.5% |
| Interquartile Range (IQR) | 7.0% | 7.1% |
| Standard Deviation (Sample) | 23.7% | 9.4% |
| Standard Deviation (Population) | 23.5% | 9.2% |
Similar Demographics by Male Disability
Demographics Similar to Immigrants from Europe by Male Disability
In terms of male disability, the demographic groups most similar to Immigrants from Europe are Nigerian (11.0%, a difference of 0.010%), South African (11.0%, a difference of 0.030%), Immigrants from Italy (11.0%, a difference of 0.040%), Arab (11.0%, a difference of 0.050%), and Immigrants from Sudan (11.0%, a difference of 0.050%).
| Demographics | Rating | Rank | Male Disability |
| Brazilians | 85.4 /100 | #130 | Excellent 10.9% |
| Macedonians | 84.2 /100 | #131 | Excellent 11.0% |
| Immigrants | Fiji | 84.0 /100 | #132 | Excellent 11.0% |
| Ugandans | 83.9 /100 | #133 | Excellent 11.0% |
| Bhutanese | 83.4 /100 | #134 | Excellent 11.0% |
| Trinidadians and Tobagonians | 83.3 /100 | #135 | Excellent 11.0% |
| Immigrants | Costa Rica | 82.8 /100 | #136 | Excellent 11.0% |
| Immigrants | Europe | 82.0 /100 | #137 | Excellent 11.0% |
| Nigerians | 81.9 /100 | #138 | Excellent 11.0% |
| South Africans | 81.7 /100 | #139 | Excellent 11.0% |
| Immigrants | Italy | 81.5 /100 | #140 | Excellent 11.0% |
| Arabs | 81.5 /100 | #141 | Excellent 11.0% |
| Immigrants | Sudan | 81.5 /100 | #142 | Excellent 11.0% |
| Moroccans | 80.7 /100 | #143 | Excellent 11.0% |
| Kenyans | 78.1 /100 | #144 | Good 11.0% |
Demographics Similar to Houma by Male Disability
In terms of male disability, the demographic groups most similar to Houma are Colville (16.5%, a difference of 5.7%), Tsimshian (15.6%, a difference of 11.8%), Puerto Rican (15.6%, a difference of 12.1%), Creek (15.5%, a difference of 12.3%), and Kiowa (15.4%, a difference of 13.0%).
| Demographics | Rating | Rank | Male Disability |
| Yuman | 0.0 /100 | #333 | Tragic 14.7% |
| Cherokee | 0.0 /100 | #334 | Tragic 14.8% |
| Dutch West Indians | 0.0 /100 | #335 | Tragic 14.8% |
| Alaskan Athabascans | 0.0 /100 | #336 | Tragic 14.9% |
| Menominee | 0.0 /100 | #337 | Tragic 15.0% |
| Pueblo | 0.0 /100 | #338 | Tragic 15.0% |
| Chickasaw | 0.0 /100 | #339 | Tragic 15.1% |
| Lumbee | 0.0 /100 | #340 | Tragic 15.2% |
| Choctaw | 0.0 /100 | #341 | Tragic 15.4% |
| Kiowa | 0.0 /100 | #342 | Tragic 15.4% |
| Creek | 0.0 /100 | #343 | Tragic 15.5% |
| Puerto Ricans | 0.0 /100 | #344 | Tragic 15.6% |
| Tsimshian | 0.0 /100 | #345 | Tragic 15.6% |
| Colville | 0.0 /100 | #346 | Tragic 16.5% |
| Houma | 0.0 /100 | #347 | Tragic 17.4% |