Immigrants from Israel vs Houma Male Disability
COMPARE
Immigrants from Israel
Houma
Male Disability
Male Disability Comparison
Immigrants from Israel
Houma
9.6%
MALE DISABILITY
100.0/ 100
METRIC RATING
10th/ 347
METRIC RANK
17.4%
MALE DISABILITY
0.0/ 100
METRIC RATING
347th/ 347
METRIC RANK
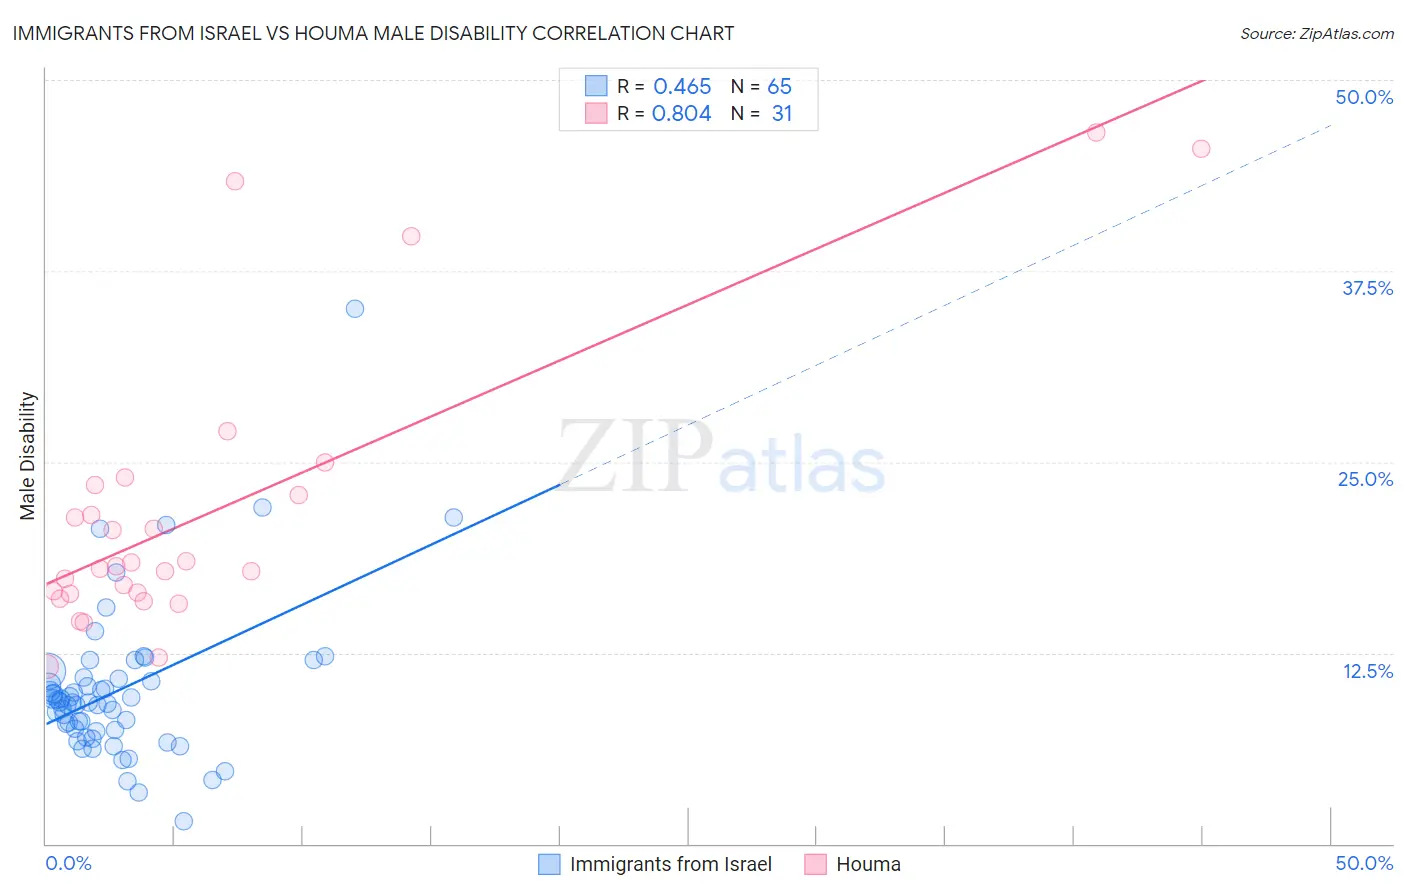
Immigrants from Israel vs Houma Male Disability Correlation Chart
The statistical analysis conducted on geographies consisting of 210,033,213 people shows a moderate positive correlation between the proportion of Immigrants from Israel and percentage of males with a disability in the United States with a correlation coefficient (R) of 0.465 and weighted average of 9.6%. Similarly, the statistical analysis conducted on geographies consisting of 36,793,255 people shows a very strong positive correlation between the proportion of Houma and percentage of males with a disability in the United States with a correlation coefficient (R) of 0.804 and weighted average of 17.4%, a difference of 82.3%.
Male Disability Correlation Summary
| Measurement | Immigrants from Israel | Houma |
| Minimum | 1.5% | 11.6% |
| Maximum | 35.0% | 46.6% |
| Range | 33.5% | 35.0% |
| Mean | 10.1% | 21.8% |
| Median | 9.3% | 18.2% |
| Interquartile 25% (IQ1) | 7.4% | 16.4% |
| Interquartile 75% (IQ3) | 10.8% | 23.5% |
| Interquartile Range (IQR) | 3.4% | 7.1% |
| Standard Deviation (Sample) | 5.1% | 9.4% |
| Standard Deviation (Population) | 5.1% | 9.2% |
Similar Demographics by Male Disability
Demographics Similar to Immigrants from Israel by Male Disability
In terms of male disability, the demographic groups most similar to Immigrants from Israel are Immigrants from Singapore (9.5%, a difference of 0.43%), Immigrants from China (9.5%, a difference of 0.51%), Immigrants from Eastern Asia (9.6%, a difference of 0.55%), Bolivian (9.6%, a difference of 0.79%), and Iranian (9.7%, a difference of 1.0%).
| Demographics | Rating | Rank | Male Disability |
| Filipinos | 100.0 /100 | #3 | Exceptional 9.1% |
| Thais | 100.0 /100 | #4 | Exceptional 9.2% |
| Immigrants | Hong Kong | 100.0 /100 | #5 | Exceptional 9.4% |
| Immigrants | South Central Asia | 100.0 /100 | #6 | Exceptional 9.4% |
| Immigrants | Bolivia | 100.0 /100 | #7 | Exceptional 9.5% |
| Immigrants | China | 100.0 /100 | #8 | Exceptional 9.5% |
| Immigrants | Singapore | 100.0 /100 | #9 | Exceptional 9.5% |
| Immigrants | Israel | 100.0 /100 | #10 | Exceptional 9.6% |
| Immigrants | Eastern Asia | 100.0 /100 | #11 | Exceptional 9.6% |
| Bolivians | 100.0 /100 | #12 | Exceptional 9.6% |
| Iranians | 100.0 /100 | #13 | Exceptional 9.7% |
| Immigrants | Iran | 100.0 /100 | #14 | Exceptional 9.7% |
| Indians (Asian) | 100.0 /100 | #15 | Exceptional 9.7% |
| Okinawans | 100.0 /100 | #16 | Exceptional 9.8% |
| Immigrants | Korea | 100.0 /100 | #17 | Exceptional 9.8% |
Demographics Similar to Houma by Male Disability
In terms of male disability, the demographic groups most similar to Houma are Colville (16.5%, a difference of 5.7%), Tsimshian (15.6%, a difference of 11.8%), Puerto Rican (15.6%, a difference of 12.1%), Creek (15.5%, a difference of 12.3%), and Kiowa (15.4%, a difference of 13.0%).
| Demographics | Rating | Rank | Male Disability |
| Yuman | 0.0 /100 | #333 | Tragic 14.7% |
| Cherokee | 0.0 /100 | #334 | Tragic 14.8% |
| Dutch West Indians | 0.0 /100 | #335 | Tragic 14.8% |
| Alaskan Athabascans | 0.0 /100 | #336 | Tragic 14.9% |
| Menominee | 0.0 /100 | #337 | Tragic 15.0% |
| Pueblo | 0.0 /100 | #338 | Tragic 15.0% |
| Chickasaw | 0.0 /100 | #339 | Tragic 15.1% |
| Lumbee | 0.0 /100 | #340 | Tragic 15.2% |
| Choctaw | 0.0 /100 | #341 | Tragic 15.4% |
| Kiowa | 0.0 /100 | #342 | Tragic 15.4% |
| Creek | 0.0 /100 | #343 | Tragic 15.5% |
| Puerto Ricans | 0.0 /100 | #344 | Tragic 15.6% |
| Tsimshian | 0.0 /100 | #345 | Tragic 15.6% |
| Colville | 0.0 /100 | #346 | Tragic 16.5% |
| Houma | 0.0 /100 | #347 | Tragic 17.4% |