Carpatho Rusyn vs Canadian Disability
COMPARE
Carpatho Rusyn
Canadian
Disability
Disability Comparison
Carpatho Rusyns
Canadians
12.3%
DISABILITY
1.4/ 100
METRIC RATING
249th/ 347
METRIC RANK
12.4%
DISABILITY
0.4/ 100
METRIC RATING
259th/ 347
METRIC RANK
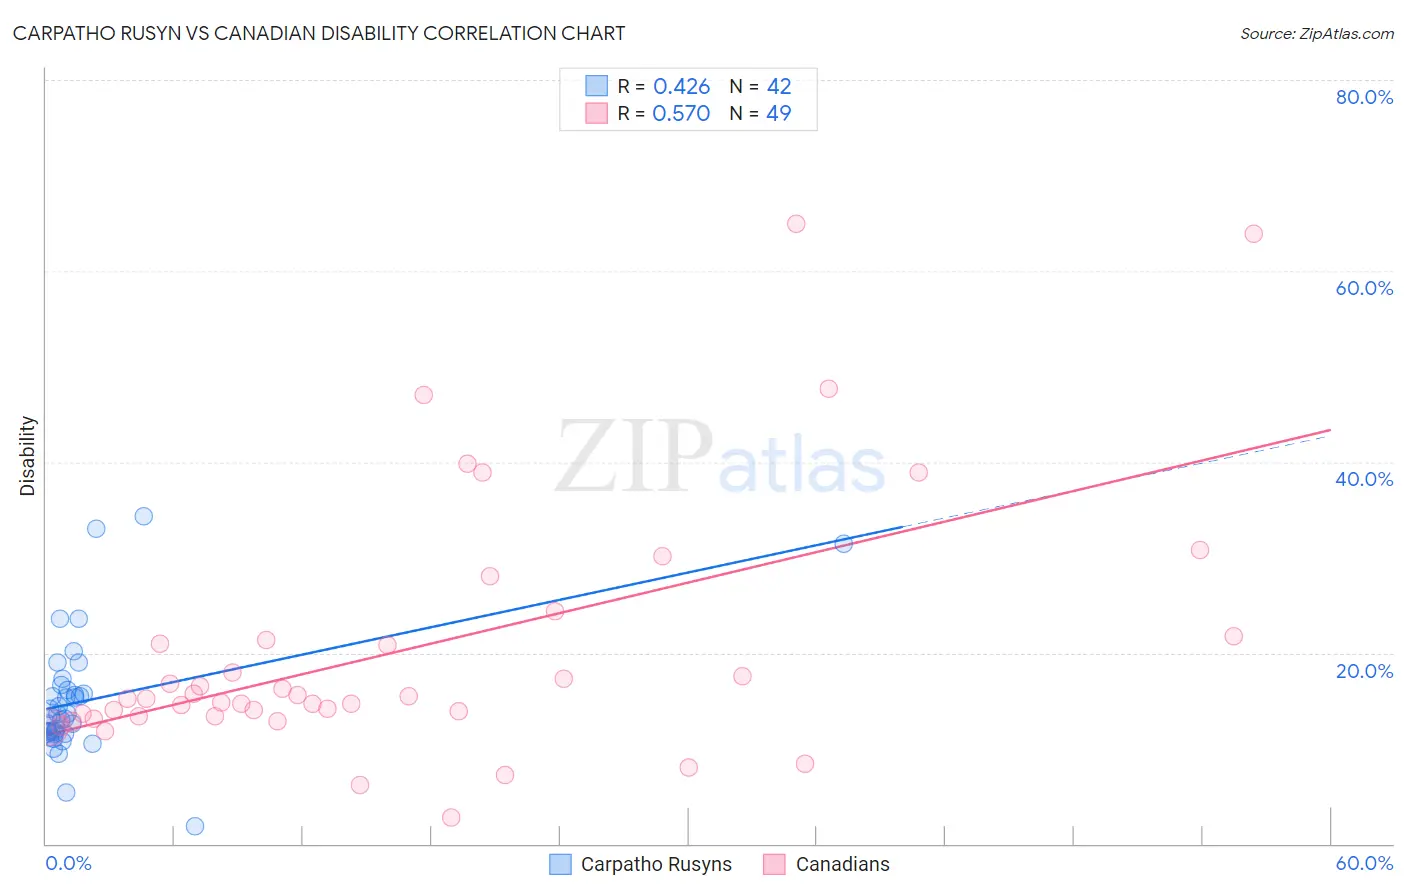
Carpatho Rusyn vs Canadian Disability Correlation Chart
The statistical analysis conducted on geographies consisting of 58,872,415 people shows a moderate positive correlation between the proportion of Carpatho Rusyns and percentage of population with a disability in the United States with a correlation coefficient (R) of 0.426 and weighted average of 12.3%. Similarly, the statistical analysis conducted on geographies consisting of 437,501,505 people shows a substantial positive correlation between the proportion of Canadians and percentage of population with a disability in the United States with a correlation coefficient (R) of 0.570 and weighted average of 12.4%, a difference of 1.2%.
Disability Correlation Summary
| Measurement | Carpatho Rusyn | Canadian |
| Minimum | 1.9% | 2.8% |
| Maximum | 34.3% | 65.0% |
| Range | 32.4% | 62.2% |
| Mean | 15.0% | 20.3% |
| Median | 13.5% | 15.2% |
| Interquartile 25% (IQ1) | 11.6% | 13.4% |
| Interquartile 75% (IQ3) | 16.0% | 21.6% |
| Interquartile Range (IQR) | 4.4% | 8.2% |
| Standard Deviation (Sample) | 6.4% | 13.5% |
| Standard Deviation (Population) | 6.3% | 13.3% |
Demographics Similar to Carpatho Rusyns and Canadians by Disability
In terms of disability, the demographic groups most similar to Carpatho Rusyns are Guamanian/Chamorro (12.3%, a difference of 0.010%), Subsaharan African (12.3%, a difference of 0.010%), European (12.3%, a difference of 0.010%), Indonesian (12.2%, a difference of 0.050%), and Swiss (12.2%, a difference of 0.080%). Similarly, the demographic groups most similar to Canadians are Immigrants from Liberia (12.4%, a difference of 0.030%), Slavic (12.4%, a difference of 0.060%), Scandinavian (12.4%, a difference of 0.10%), Immigrants from Laos (12.4%, a difference of 0.20%), and Immigrants from Dominica (12.4%, a difference of 0.29%).
| Demographics | Rating | Rank | Disability |
| Basques | 1.5 /100 | #244 | Tragic 12.2% |
| Liberians | 1.5 /100 | #245 | Tragic 12.2% |
| Swiss | 1.5 /100 | #246 | Tragic 12.2% |
| Indonesians | 1.4 /100 | #247 | Tragic 12.2% |
| Guamanians/Chamorros | 1.4 /100 | #248 | Tragic 12.3% |
| Carpatho Rusyns | 1.4 /100 | #249 | Tragic 12.3% |
| Sub-Saharan Africans | 1.4 /100 | #250 | Tragic 12.3% |
| Europeans | 1.4 /100 | #251 | Tragic 12.3% |
| Bermudans | 1.1 /100 | #252 | Tragic 12.3% |
| Belgians | 0.8 /100 | #253 | Tragic 12.3% |
| German Russians | 0.8 /100 | #254 | Tragic 12.3% |
| Slovenes | 0.6 /100 | #255 | Tragic 12.4% |
| Immigrants | Dominica | 0.6 /100 | #256 | Tragic 12.4% |
| Immigrants | Laos | 0.5 /100 | #257 | Tragic 12.4% |
| Slavs | 0.5 /100 | #258 | Tragic 12.4% |
| Canadians | 0.4 /100 | #259 | Tragic 12.4% |
| Immigrants | Liberia | 0.4 /100 | #260 | Tragic 12.4% |
| Scandinavians | 0.4 /100 | #261 | Tragic 12.4% |
| Native Hawaiians | 0.3 /100 | #262 | Tragic 12.5% |
| Hawaiians | 0.2 /100 | #263 | Tragic 12.5% |
| Immigrants | Germany | 0.2 /100 | #264 | Tragic 12.5% |