Cape Verdean vs Paraguayan Ambulatory Disability
COMPARE
Cape Verdean
Paraguayan
Ambulatory Disability
Ambulatory Disability Comparison
Cape Verdeans
Paraguayans
6.9%
AMBULATORY DISABILITY
0.0/ 100
METRIC RATING
294th/ 347
METRIC RANK
5.5%
AMBULATORY DISABILITY
99.9/ 100
METRIC RATING
43rd/ 347
METRIC RANK
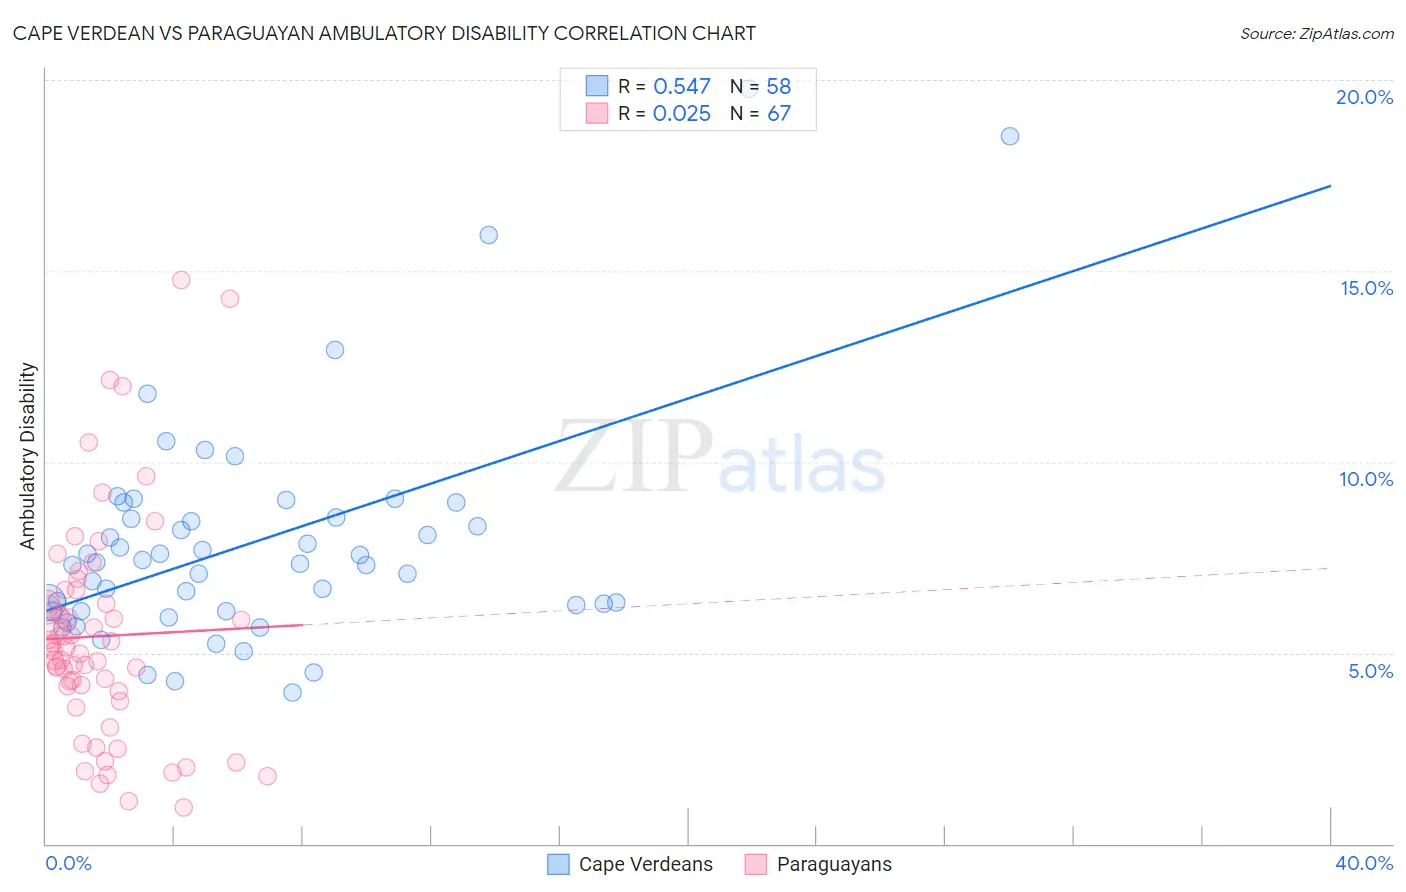
Cape Verdean vs Paraguayan Ambulatory Disability Correlation Chart
The statistical analysis conducted on geographies consisting of 107,569,251 people shows a substantial positive correlation between the proportion of Cape Verdeans and percentage of population with ambulatory disability in the United States with a correlation coefficient (R) of 0.547 and weighted average of 6.9%. Similarly, the statistical analysis conducted on geographies consisting of 95,109,897 people shows no correlation between the proportion of Paraguayans and percentage of population with ambulatory disability in the United States with a correlation coefficient (R) of 0.025 and weighted average of 5.5%, a difference of 24.6%.
Ambulatory Disability Correlation Summary
| Measurement | Cape Verdean | Paraguayan |
| Minimum | 4.0% | 0.94% |
| Maximum | 19.8% | 14.7% |
| Range | 15.8% | 13.8% |
| Mean | 7.9% | 5.4% |
| Median | 7.3% | 5.2% |
| Interquartile 25% (IQ1) | 6.1% | 4.0% |
| Interquartile 75% (IQ3) | 8.6% | 6.3% |
| Interquartile Range (IQR) | 2.5% | 2.4% |
| Standard Deviation (Sample) | 3.0% | 2.9% |
| Standard Deviation (Population) | 3.0% | 2.8% |
Similar Demographics by Ambulatory Disability
Demographics Similar to Cape Verdeans by Ambulatory Disability
In terms of ambulatory disability, the demographic groups most similar to Cape Verdeans are Crow (6.9%, a difference of 0.070%), Immigrants from St. Vincent and the Grenadines (6.9%, a difference of 0.19%), Alaskan Athabascan (6.9%, a difference of 0.30%), Cheyenne (6.9%, a difference of 0.42%), and French American Indian (6.9%, a difference of 0.47%).
| Demographics | Rating | Rank | Ambulatory Disability |
| U.S. Virgin Islanders | 0.0 /100 | #287 | Tragic 6.8% |
| Immigrants | Nonimmigrants | 0.0 /100 | #288 | Tragic 6.9% |
| Immigrants | Dominica | 0.0 /100 | #289 | Tragic 6.9% |
| Scotch-Irish | 0.0 /100 | #290 | Tragic 6.9% |
| West Indians | 0.0 /100 | #291 | Tragic 6.9% |
| Cheyenne | 0.0 /100 | #292 | Tragic 6.9% |
| Immigrants | St. Vincent and the Grenadines | 0.0 /100 | #293 | Tragic 6.9% |
| Cape Verdeans | 0.0 /100 | #294 | Tragic 6.9% |
| Crow | 0.0 /100 | #295 | Tragic 6.9% |
| Alaskan Athabascans | 0.0 /100 | #296 | Tragic 6.9% |
| French American Indians | 0.0 /100 | #297 | Tragic 6.9% |
| Immigrants | Grenada | 0.0 /100 | #298 | Tragic 6.9% |
| Puget Sound Salish | 0.0 /100 | #299 | Tragic 6.9% |
| Marshallese | 0.0 /100 | #300 | Tragic 6.9% |
| British West Indians | 0.0 /100 | #301 | Tragic 7.0% |
Demographics Similar to Paraguayans by Ambulatory Disability
In terms of ambulatory disability, the demographic groups most similar to Paraguayans are Immigrants from Indonesia (5.5%, a difference of 0.12%), Immigrants from Sweden (5.6%, a difference of 0.28%), Egyptian (5.6%, a difference of 0.29%), Immigrants from Japan (5.6%, a difference of 0.30%), and Immigrants from Argentina (5.6%, a difference of 0.31%).
| Demographics | Rating | Rank | Ambulatory Disability |
| Immigrants | Malaysia | 100.0 /100 | #36 | Exceptional 5.5% |
| Turks | 100.0 /100 | #37 | Exceptional 5.5% |
| Cypriots | 100.0 /100 | #38 | Exceptional 5.5% |
| Immigrants | Eritrea | 100.0 /100 | #39 | Exceptional 5.5% |
| Venezuelans | 99.9 /100 | #40 | Exceptional 5.5% |
| Mongolians | 99.9 /100 | #41 | Exceptional 5.5% |
| Argentineans | 99.9 /100 | #42 | Exceptional 5.5% |
| Paraguayans | 99.9 /100 | #43 | Exceptional 5.5% |
| Immigrants | Indonesia | 99.9 /100 | #44 | Exceptional 5.5% |
| Immigrants | Sweden | 99.9 /100 | #45 | Exceptional 5.6% |
| Egyptians | 99.9 /100 | #46 | Exceptional 5.6% |
| Immigrants | Japan | 99.9 /100 | #47 | Exceptional 5.6% |
| Immigrants | Argentina | 99.9 /100 | #48 | Exceptional 5.6% |
| Bulgarians | 99.9 /100 | #49 | Exceptional 5.6% |
| Luxembourgers | 99.9 /100 | #50 | Exceptional 5.6% |