Cape Verdean vs Immigrants from Philippines Unemployment Among Women with Children Under 18 years
COMPARE
Cape Verdean
Immigrants from Philippines
Unemployment Among Women with Children Under 18 years
Unemployment Among Women with Children Under 18 years Comparison
Cape Verdeans
Immigrants from Philippines
5.9%
UNEMPLOYMENT AMONG WOMEN WITH CHILDREN UNDER 18 YEARS
1.0/ 100
METRIC RATING
247th/ 347
METRIC RANK
5.4%
UNEMPLOYMENT AMONG WOMEN WITH CHILDREN UNDER 18 YEARS
53.1/ 100
METRIC RATING
171st/ 347
METRIC RANK
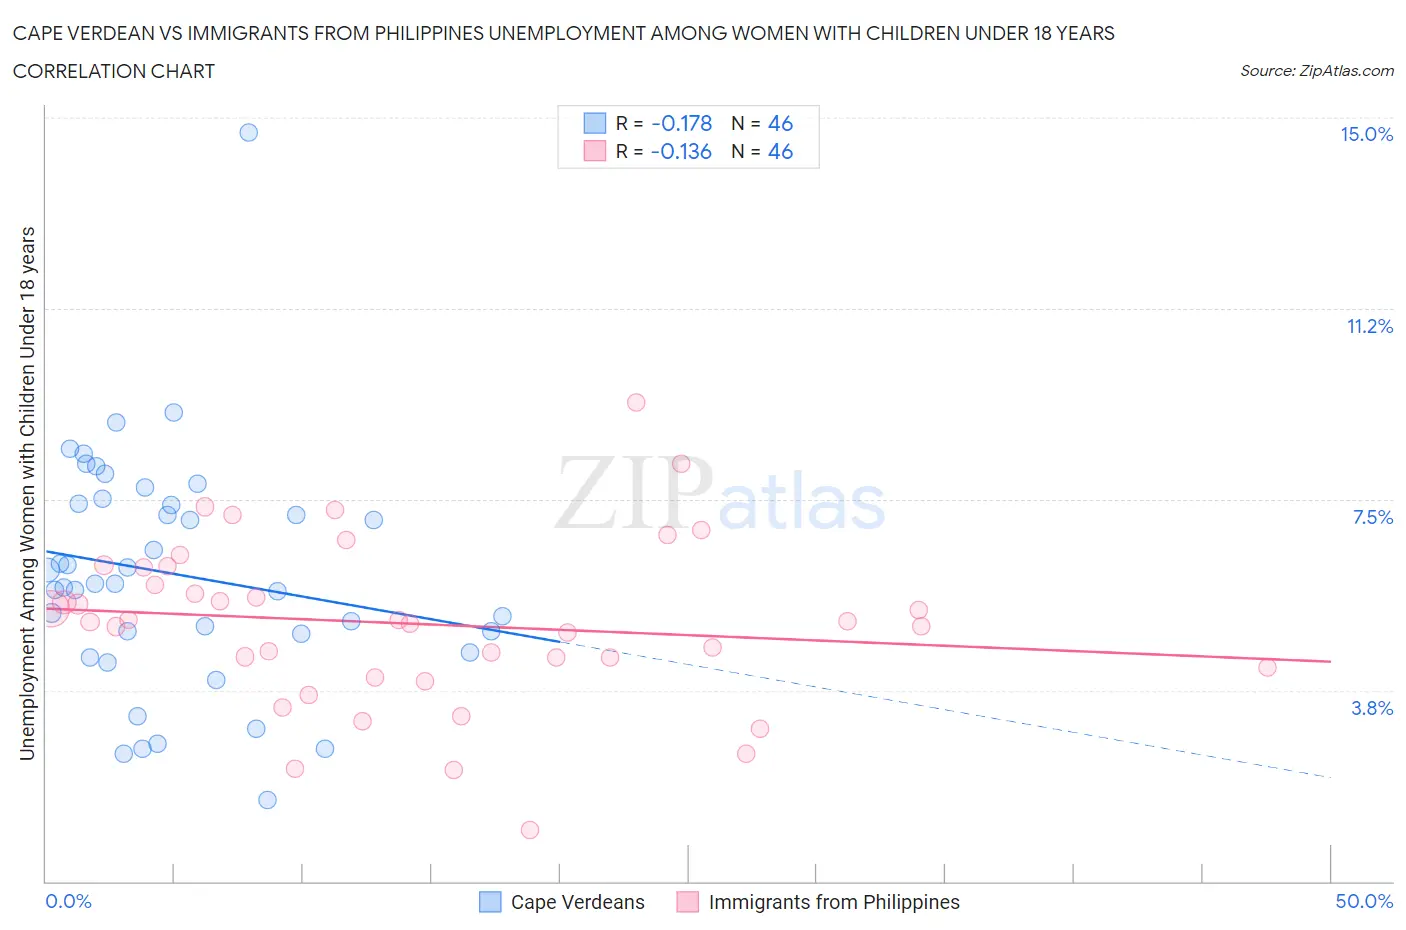
Cape Verdean vs Immigrants from Philippines Unemployment Among Women with Children Under 18 years Correlation Chart
The statistical analysis conducted on geographies consisting of 106,331,271 people shows a poor negative correlation between the proportion of Cape Verdeans and unemployment rate among women with children under the age of 18 in the United States with a correlation coefficient (R) of -0.178 and weighted average of 5.9%. Similarly, the statistical analysis conducted on geographies consisting of 447,841,859 people shows a poor negative correlation between the proportion of Immigrants from Philippines and unemployment rate among women with children under the age of 18 in the United States with a correlation coefficient (R) of -0.136 and weighted average of 5.4%, a difference of 8.5%.
Unemployment Among Women with Children Under 18 years Correlation Summary
| Measurement | Cape Verdean | Immigrants from Philippines |
| Minimum | 1.6% | 1.0% |
| Maximum | 14.7% | 9.4% |
| Range | 13.1% | 8.4% |
| Mean | 6.0% | 5.1% |
| Median | 5.9% | 5.1% |
| Interquartile 25% (IQ1) | 4.9% | 4.2% |
| Interquartile 75% (IQ3) | 7.4% | 6.2% |
| Interquartile Range (IQR) | 2.6% | 2.0% |
| Standard Deviation (Sample) | 2.3% | 1.6% |
| Standard Deviation (Population) | 2.3% | 1.6% |
Similar Demographics by Unemployment Among Women with Children Under 18 years
Demographics Similar to Cape Verdeans by Unemployment Among Women with Children Under 18 years
In terms of unemployment among women with children under 18 years, the demographic groups most similar to Cape Verdeans are Uruguayan (5.9%, a difference of 0.070%), Ugandan (5.9%, a difference of 0.21%), Delaware (5.9%, a difference of 0.22%), Choctaw (5.9%, a difference of 0.25%), and Immigrants from Uruguay (5.9%, a difference of 0.29%).
| Demographics | Rating | Rank | Unemployment Among Women with Children Under 18 years |
| Immigrants | Immigrants | 2.0 /100 | #240 | Tragic 5.8% |
| Brazilians | 1.6 /100 | #241 | Tragic 5.8% |
| Moroccans | 1.4 /100 | #242 | Tragic 5.9% |
| Immigrants | Uruguay | 1.1 /100 | #243 | Tragic 5.9% |
| Choctaw | 1.1 /100 | #244 | Tragic 5.9% |
| Ugandans | 1.1 /100 | #245 | Tragic 5.9% |
| Uruguayans | 1.0 /100 | #246 | Tragic 5.9% |
| Cape Verdeans | 1.0 /100 | #247 | Tragic 5.9% |
| Delaware | 0.8 /100 | #248 | Tragic 5.9% |
| Immigrants | Cameroon | 0.8 /100 | #249 | Tragic 5.9% |
| Immigrants | Cabo Verde | 0.7 /100 | #250 | Tragic 5.9% |
| Ute | 0.7 /100 | #251 | Tragic 5.9% |
| Seminole | 0.5 /100 | #252 | Tragic 6.0% |
| Immigrants | Congo | 0.4 /100 | #253 | Tragic 6.0% |
| Immigrants | Azores | 0.3 /100 | #254 | Tragic 6.0% |
Demographics Similar to Immigrants from Philippines by Unemployment Among Women with Children Under 18 years
In terms of unemployment among women with children under 18 years, the demographic groups most similar to Immigrants from Philippines are Samoan (5.4%, a difference of 0.070%), Immigrants from Kazakhstan (5.4%, a difference of 0.10%), Immigrants from Eastern Africa (5.4%, a difference of 0.13%), Immigrants from Thailand (5.4%, a difference of 0.16%), and Immigrants from Northern Africa (5.4%, a difference of 0.21%).
| Demographics | Rating | Rank | Unemployment Among Women with Children Under 18 years |
| Celtics | 63.0 /100 | #164 | Good 5.4% |
| Tlingit-Haida | 61.9 /100 | #165 | Good 5.4% |
| Aleuts | 59.4 /100 | #166 | Average 5.4% |
| Immigrants | Denmark | 58.0 /100 | #167 | Average 5.4% |
| Immigrants | Northern Africa | 56.1 /100 | #168 | Average 5.4% |
| Immigrants | Thailand | 55.3 /100 | #169 | Average 5.4% |
| Samoans | 54.1 /100 | #170 | Average 5.4% |
| Immigrants | Philippines | 53.1 /100 | #171 | Average 5.4% |
| Immigrants | Kazakhstan | 51.7 /100 | #172 | Average 5.4% |
| Immigrants | Eastern Africa | 51.3 /100 | #173 | Average 5.4% |
| Immigrants | Uzbekistan | 50.0 /100 | #174 | Average 5.4% |
| Spanish | 49.0 /100 | #175 | Average 5.4% |
| Immigrants | Germany | 48.5 /100 | #176 | Average 5.5% |
| Hawaiians | 46.1 /100 | #177 | Average 5.5% |
| Costa Ricans | 45.2 /100 | #178 | Average 5.5% |