Cape Verdean vs Spaniard Ambulatory Disability
COMPARE
Cape Verdean
Spaniard
Ambulatory Disability
Ambulatory Disability Comparison
Cape Verdeans
Spaniards
6.9%
AMBULATORY DISABILITY
0.0/ 100
METRIC RATING
294th/ 347
METRIC RANK
6.5%
AMBULATORY DISABILITY
1.6/ 100
METRIC RATING
242nd/ 347
METRIC RANK
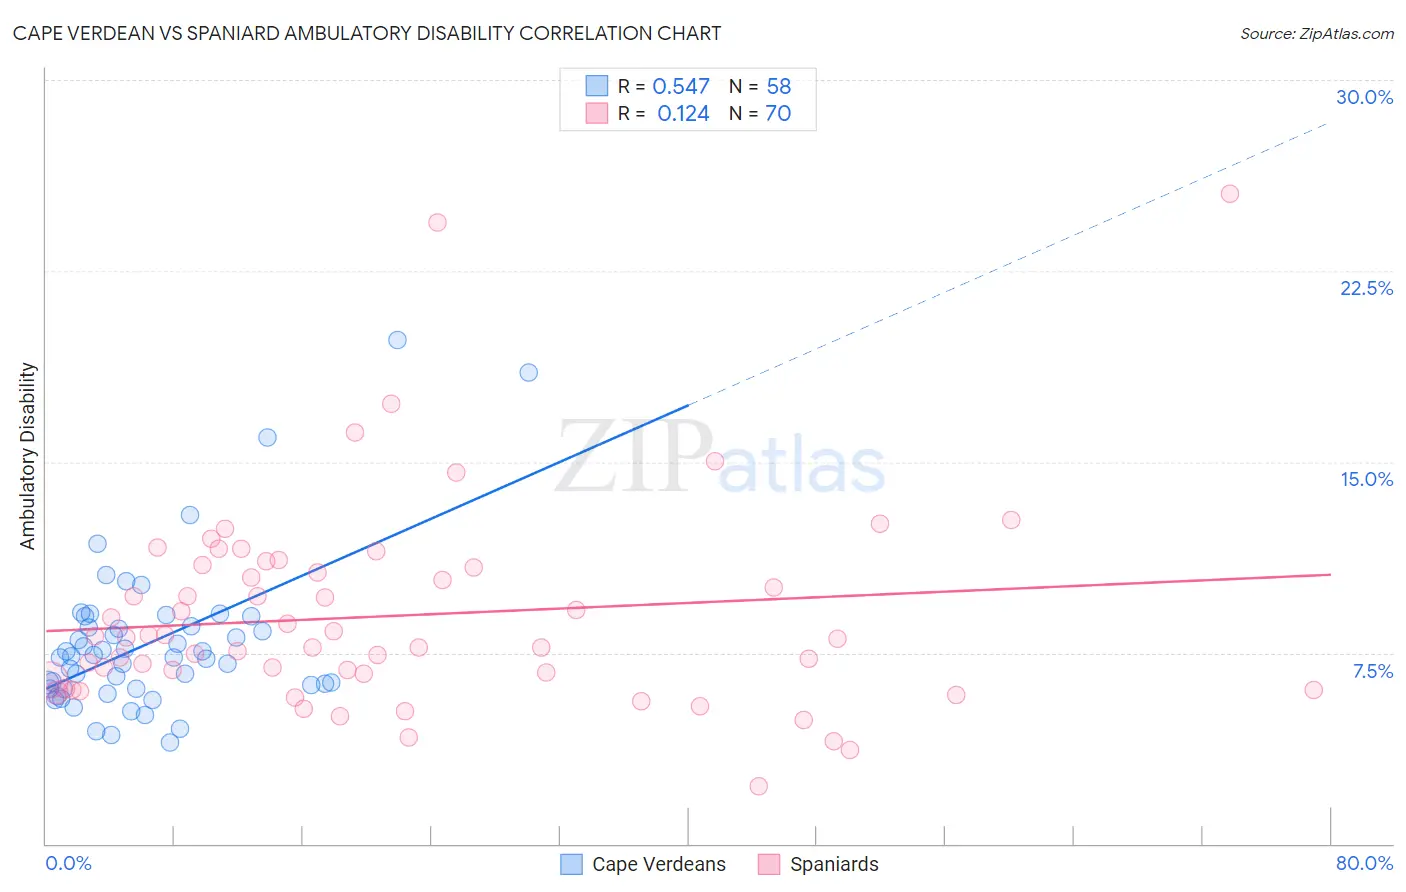
Cape Verdean vs Spaniard Ambulatory Disability Correlation Chart
The statistical analysis conducted on geographies consisting of 107,569,251 people shows a substantial positive correlation between the proportion of Cape Verdeans and percentage of population with ambulatory disability in the United States with a correlation coefficient (R) of 0.547 and weighted average of 6.9%. Similarly, the statistical analysis conducted on geographies consisting of 443,300,484 people shows a poor positive correlation between the proportion of Spaniards and percentage of population with ambulatory disability in the United States with a correlation coefficient (R) of 0.124 and weighted average of 6.5%, a difference of 7.0%.
Ambulatory Disability Correlation Summary
| Measurement | Cape Verdean | Spaniard |
| Minimum | 4.0% | 2.3% |
| Maximum | 19.8% | 25.6% |
| Range | 15.8% | 23.3% |
| Mean | 7.9% | 9.0% |
| Median | 7.3% | 8.1% |
| Interquartile 25% (IQ1) | 6.1% | 6.4% |
| Interquartile 75% (IQ3) | 8.6% | 10.9% |
| Interquartile Range (IQR) | 2.5% | 4.4% |
| Standard Deviation (Sample) | 3.0% | 4.1% |
| Standard Deviation (Population) | 3.0% | 4.0% |
Similar Demographics by Ambulatory Disability
Demographics Similar to Cape Verdeans by Ambulatory Disability
In terms of ambulatory disability, the demographic groups most similar to Cape Verdeans are Crow (6.9%, a difference of 0.070%), Immigrants from St. Vincent and the Grenadines (6.9%, a difference of 0.19%), Alaskan Athabascan (6.9%, a difference of 0.30%), Cheyenne (6.9%, a difference of 0.42%), and French American Indian (6.9%, a difference of 0.47%).
| Demographics | Rating | Rank | Ambulatory Disability |
| U.S. Virgin Islanders | 0.0 /100 | #287 | Tragic 6.8% |
| Immigrants | Nonimmigrants | 0.0 /100 | #288 | Tragic 6.9% |
| Immigrants | Dominica | 0.0 /100 | #289 | Tragic 6.9% |
| Scotch-Irish | 0.0 /100 | #290 | Tragic 6.9% |
| West Indians | 0.0 /100 | #291 | Tragic 6.9% |
| Cheyenne | 0.0 /100 | #292 | Tragic 6.9% |
| Immigrants | St. Vincent and the Grenadines | 0.0 /100 | #293 | Tragic 6.9% |
| Cape Verdeans | 0.0 /100 | #294 | Tragic 6.9% |
| Crow | 0.0 /100 | #295 | Tragic 6.9% |
| Alaskan Athabascans | 0.0 /100 | #296 | Tragic 6.9% |
| French American Indians | 0.0 /100 | #297 | Tragic 6.9% |
| Immigrants | Grenada | 0.0 /100 | #298 | Tragic 6.9% |
| Puget Sound Salish | 0.0 /100 | #299 | Tragic 6.9% |
| Marshallese | 0.0 /100 | #300 | Tragic 6.9% |
| British West Indians | 0.0 /100 | #301 | Tragic 7.0% |
Demographics Similar to Spaniards by Ambulatory Disability
In terms of ambulatory disability, the demographic groups most similar to Spaniards are German (6.5%, a difference of 0.020%), Immigrants from Panama (6.5%, a difference of 0.020%), Immigrants from Haiti (6.5%, a difference of 0.030%), Tlingit-Haida (6.5%, a difference of 0.060%), and Armenian (6.5%, a difference of 0.070%).
| Demographics | Rating | Rank | Ambulatory Disability |
| Hispanics or Latinos | 2.2 /100 | #235 | Tragic 6.4% |
| Dutch | 2.0 /100 | #236 | Tragic 6.4% |
| Immigrants | Germany | 1.8 /100 | #237 | Tragic 6.4% |
| Haitians | 1.8 /100 | #238 | Tragic 6.4% |
| Senegalese | 1.7 /100 | #239 | Tragic 6.4% |
| Immigrants | Senegal | 1.7 /100 | #240 | Tragic 6.4% |
| Immigrants | Haiti | 1.6 /100 | #241 | Tragic 6.5% |
| Spaniards | 1.6 /100 | #242 | Tragic 6.5% |
| Germans | 1.5 /100 | #243 | Tragic 6.5% |
| Immigrants | Panama | 1.5 /100 | #244 | Tragic 6.5% |
| Tlingit-Haida | 1.5 /100 | #245 | Tragic 6.5% |
| Armenians | 1.5 /100 | #246 | Tragic 6.5% |
| Immigrants | Cuba | 1.4 /100 | #247 | Tragic 6.5% |
| Immigrants | Portugal | 1.4 /100 | #248 | Tragic 6.5% |
| Native Hawaiians | 1.1 /100 | #249 | Tragic 6.5% |