Burmese vs Immigrants from Sri Lanka Hearing Disability
COMPARE
Burmese
Immigrants from Sri Lanka
Hearing Disability
Hearing Disability Comparison
Burmese
Immigrants from Sri Lanka
2.8%
HEARING DISABILITY
94.2/ 100
METRIC RATING
104th/ 347
METRIC RANK
2.7%
HEARING DISABILITY
98.4/ 100
METRIC RATING
64th/ 347
METRIC RANK
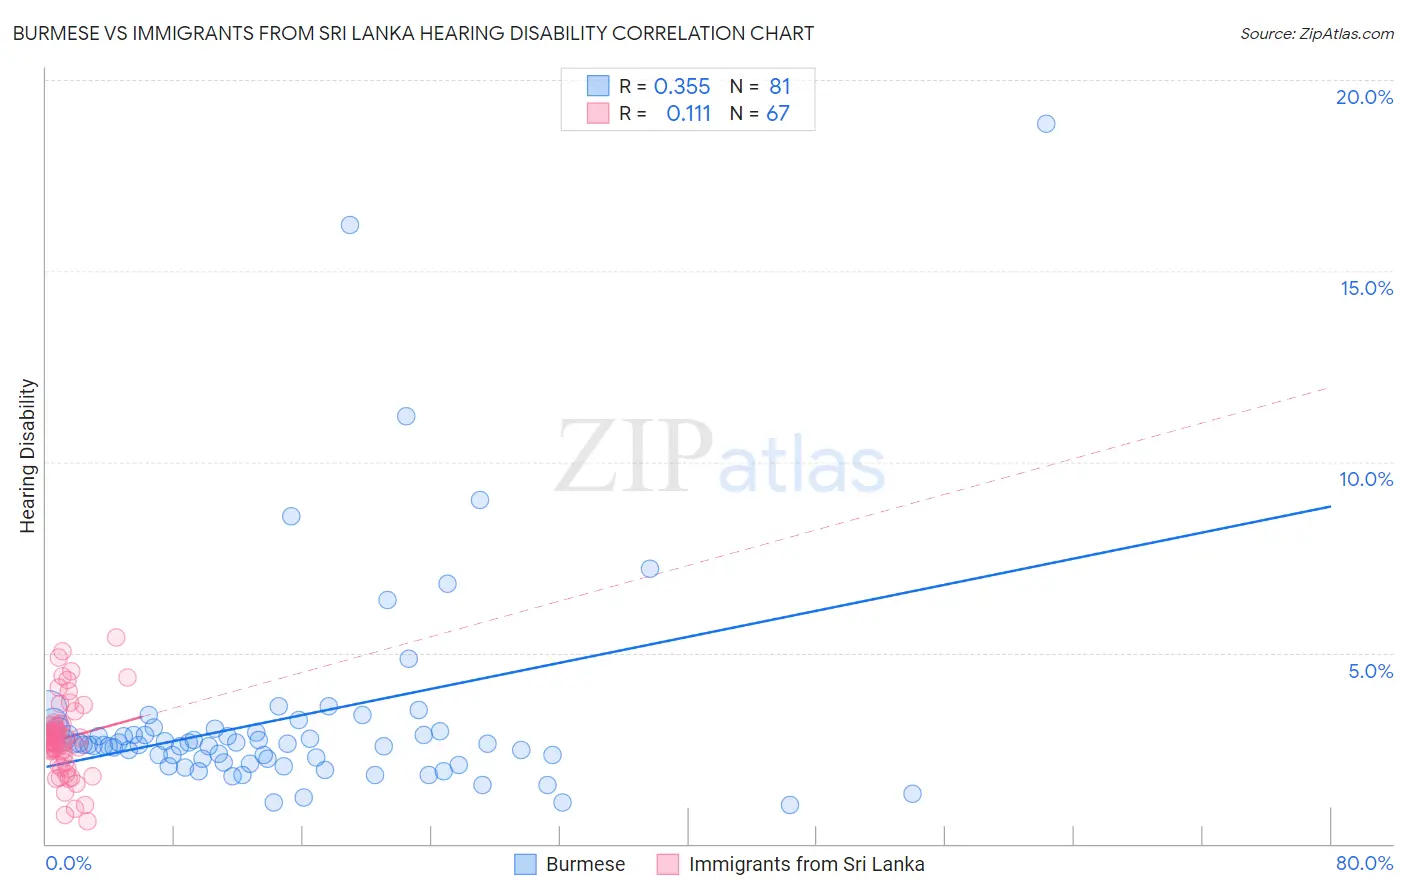
Burmese vs Immigrants from Sri Lanka Hearing Disability Correlation Chart
The statistical analysis conducted on geographies consisting of 465,070,150 people shows a mild positive correlation between the proportion of Burmese and percentage of population with hearing disability in the United States with a correlation coefficient (R) of 0.355 and weighted average of 2.8%. Similarly, the statistical analysis conducted on geographies consisting of 149,683,223 people shows a poor positive correlation between the proportion of Immigrants from Sri Lanka and percentage of population with hearing disability in the United States with a correlation coefficient (R) of 0.111 and weighted average of 2.7%, a difference of 3.4%.
Hearing Disability Correlation Summary
| Measurement | Burmese | Immigrants from Sri Lanka |
| Minimum | 1.0% | 0.58% |
| Maximum | 18.9% | 5.4% |
| Range | 17.8% | 4.8% |
| Mean | 3.3% | 2.8% |
| Median | 2.6% | 2.7% |
| Interquartile 25% (IQ1) | 2.2% | 2.3% |
| Interquartile 75% (IQ3) | 3.0% | 3.1% |
| Interquartile Range (IQR) | 0.80% | 0.80% |
| Standard Deviation (Sample) | 2.8% | 0.97% |
| Standard Deviation (Population) | 2.8% | 0.97% |
Similar Demographics by Hearing Disability
Demographics Similar to Burmese by Hearing Disability
In terms of hearing disability, the demographic groups most similar to Burmese are Moroccan (2.8%, a difference of 0.11%), Immigrants from Indonesia (2.8%, a difference of 0.27%), Taiwanese (2.8%, a difference of 0.32%), Immigrants from Spain (2.8%, a difference of 0.33%), and Honduran (2.8%, a difference of 0.35%).
| Demographics | Rating | Rank | Hearing Disability |
| Immigrants | Afghanistan | 95.3 /100 | #97 | Exceptional 2.8% |
| Immigrants | Honduras | 95.1 /100 | #98 | Exceptional 2.8% |
| Immigrants | Guatemala | 95.1 /100 | #99 | Exceptional 2.8% |
| Immigrants | Eastern Africa | 95.0 /100 | #100 | Exceptional 2.8% |
| Immigrants | Spain | 94.9 /100 | #101 | Exceptional 2.8% |
| Taiwanese | 94.8 /100 | #102 | Exceptional 2.8% |
| Immigrants | Indonesia | 94.7 /100 | #103 | Exceptional 2.8% |
| Burmese | 94.2 /100 | #104 | Exceptional 2.8% |
| Moroccans | 93.9 /100 | #105 | Exceptional 2.8% |
| Hondurans | 93.4 /100 | #106 | Exceptional 2.8% |
| Immigrants | Chile | 93.4 /100 | #107 | Exceptional 2.8% |
| Guatemalans | 93.2 /100 | #108 | Exceptional 2.8% |
| Turks | 93.0 /100 | #109 | Exceptional 2.8% |
| Cypriots | 92.9 /100 | #110 | Exceptional 2.8% |
| Immigrants | Yemen | 92.7 /100 | #111 | Exceptional 2.8% |
Demographics Similar to Immigrants from Sri Lanka by Hearing Disability
In terms of hearing disability, the demographic groups most similar to Immigrants from Sri Lanka are Indian (Asian) (2.7%, a difference of 0.050%), Immigrants from Nepal (2.7%, a difference of 0.080%), Immigrants from Uzbekistan (2.7%, a difference of 0.11%), Immigrants from Colombia (2.7%, a difference of 0.11%), and Immigrants from Belize (2.7%, a difference of 0.21%).
| Demographics | Rating | Rank | Hearing Disability |
| South Americans | 99.0 /100 | #57 | Exceptional 2.7% |
| Immigrants | Peru | 98.6 /100 | #58 | Exceptional 2.7% |
| Immigrants | Eritrea | 98.5 /100 | #59 | Exceptional 2.7% |
| Immigrants | Egypt | 98.5 /100 | #60 | Exceptional 2.7% |
| Immigrants | Uzbekistan | 98.4 /100 | #61 | Exceptional 2.7% |
| Immigrants | Colombia | 98.4 /100 | #62 | Exceptional 2.7% |
| Indians (Asian) | 98.4 /100 | #63 | Exceptional 2.7% |
| Immigrants | Sri Lanka | 98.4 /100 | #64 | Exceptional 2.7% |
| Immigrants | Nepal | 98.3 /100 | #65 | Exceptional 2.7% |
| Immigrants | Belize | 98.2 /100 | #66 | Exceptional 2.7% |
| Egyptians | 98.1 /100 | #67 | Exceptional 2.7% |
| Immigrants | Africa | 98.0 /100 | #68 | Exceptional 2.7% |
| Nicaraguans | 97.9 /100 | #69 | Exceptional 2.7% |
| Peruvians | 97.7 /100 | #70 | Exceptional 2.7% |
| Central Americans | 97.7 /100 | #71 | Exceptional 2.7% |