Vietnamese vs Immigrants from Sri Lanka Hearing Disability
COMPARE
Vietnamese
Immigrants from Sri Lanka
Hearing Disability
Hearing Disability Comparison
Vietnamese
Immigrants from Sri Lanka
2.4%
HEARING DISABILITY
100.0/ 100
METRIC RATING
6th/ 347
METRIC RANK
2.7%
HEARING DISABILITY
98.4/ 100
METRIC RATING
64th/ 347
METRIC RANK
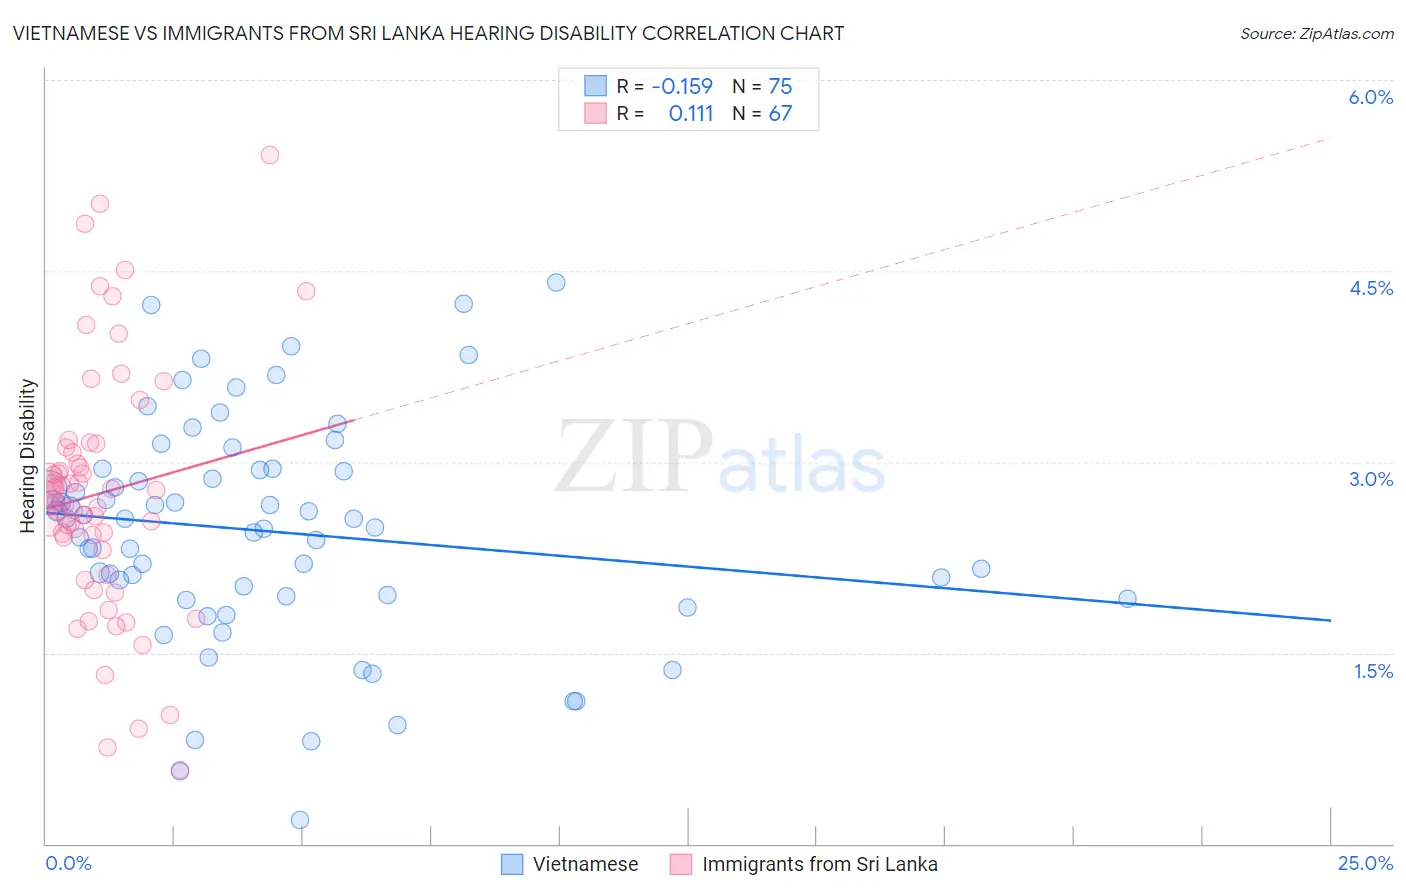
Vietnamese vs Immigrants from Sri Lanka Hearing Disability Correlation Chart
The statistical analysis conducted on geographies consisting of 170,714,585 people shows a poor negative correlation between the proportion of Vietnamese and percentage of population with hearing disability in the United States with a correlation coefficient (R) of -0.159 and weighted average of 2.4%. Similarly, the statistical analysis conducted on geographies consisting of 149,683,223 people shows a poor positive correlation between the proportion of Immigrants from Sri Lanka and percentage of population with hearing disability in the United States with a correlation coefficient (R) of 0.111 and weighted average of 2.7%, a difference of 13.4%.
Hearing Disability Correlation Summary
| Measurement | Vietnamese | Immigrants from Sri Lanka |
| Minimum | 0.18% | 0.58% |
| Maximum | 4.4% | 5.4% |
| Range | 4.2% | 4.8% |
| Mean | 2.5% | 2.8% |
| Median | 2.6% | 2.7% |
| Interquartile 25% (IQ1) | 1.9% | 2.3% |
| Interquartile 75% (IQ3) | 2.9% | 3.1% |
| Interquartile Range (IQR) | 0.99% | 0.80% |
| Standard Deviation (Sample) | 0.87% | 0.97% |
| Standard Deviation (Population) | 0.87% | 0.97% |
Similar Demographics by Hearing Disability
Demographics Similar to Vietnamese by Hearing Disability
In terms of hearing disability, the demographic groups most similar to Vietnamese are Immigrants from Barbados (2.4%, a difference of 1.1%), Immigrants from Bangladesh (2.4%, a difference of 1.6%), British West Indian (2.4%, a difference of 1.8%), Immigrants from Dominican Republic (2.4%, a difference of 2.6%), and Immigrants from Guyana (2.3%, a difference of 3.0%).
| Demographics | Rating | Rank | Hearing Disability |
| Immigrants | Grenada | 100.0 /100 | #1 | Exceptional 2.2% |
| Immigrants | St. Vincent and the Grenadines | 100.0 /100 | #2 | Exceptional 2.3% |
| Guyanese | 100.0 /100 | #3 | Exceptional 2.3% |
| Immigrants | Guyana | 100.0 /100 | #4 | Exceptional 2.3% |
| Immigrants | Barbados | 100.0 /100 | #5 | Exceptional 2.4% |
| Vietnamese | 100.0 /100 | #6 | Exceptional 2.4% |
| Immigrants | Bangladesh | 100.0 /100 | #7 | Exceptional 2.4% |
| British West Indians | 100.0 /100 | #8 | Exceptional 2.4% |
| Immigrants | Dominican Republic | 100.0 /100 | #9 | Exceptional 2.4% |
| Immigrants | Ecuador | 99.9 /100 | #10 | Exceptional 2.5% |
| Immigrants | Trinidad and Tobago | 99.9 /100 | #11 | Exceptional 2.5% |
| Trinidadians and Tobagonians | 99.9 /100 | #12 | Exceptional 2.5% |
| Sierra Leoneans | 99.9 /100 | #13 | Exceptional 2.5% |
| Ecuadorians | 99.9 /100 | #14 | Exceptional 2.5% |
| Barbadians | 99.9 /100 | #15 | Exceptional 2.5% |
Demographics Similar to Immigrants from Sri Lanka by Hearing Disability
In terms of hearing disability, the demographic groups most similar to Immigrants from Sri Lanka are Indian (Asian) (2.7%, a difference of 0.050%), Immigrants from Nepal (2.7%, a difference of 0.080%), Immigrants from Uzbekistan (2.7%, a difference of 0.11%), Immigrants from Colombia (2.7%, a difference of 0.11%), and Immigrants from Belize (2.7%, a difference of 0.21%).
| Demographics | Rating | Rank | Hearing Disability |
| South Americans | 99.0 /100 | #57 | Exceptional 2.7% |
| Immigrants | Peru | 98.6 /100 | #58 | Exceptional 2.7% |
| Immigrants | Eritrea | 98.5 /100 | #59 | Exceptional 2.7% |
| Immigrants | Egypt | 98.5 /100 | #60 | Exceptional 2.7% |
| Immigrants | Uzbekistan | 98.4 /100 | #61 | Exceptional 2.7% |
| Immigrants | Colombia | 98.4 /100 | #62 | Exceptional 2.7% |
| Indians (Asian) | 98.4 /100 | #63 | Exceptional 2.7% |
| Immigrants | Sri Lanka | 98.4 /100 | #64 | Exceptional 2.7% |
| Immigrants | Nepal | 98.3 /100 | #65 | Exceptional 2.7% |
| Immigrants | Belize | 98.2 /100 | #66 | Exceptional 2.7% |
| Egyptians | 98.1 /100 | #67 | Exceptional 2.7% |
| Immigrants | Africa | 98.0 /100 | #68 | Exceptional 2.7% |
| Nicaraguans | 97.9 /100 | #69 | Exceptional 2.7% |
| Peruvians | 97.7 /100 | #70 | Exceptional 2.7% |
| Central Americans | 97.7 /100 | #71 | Exceptional 2.7% |