Burmese vs American Hearing Disability
COMPARE
Burmese
American
Hearing Disability
Hearing Disability Comparison
Burmese
Americans
2.8%
HEARING DISABILITY
94.2/ 100
METRIC RATING
104th/ 347
METRIC RANK
3.9%
HEARING DISABILITY
0.0/ 100
METRIC RATING
311th/ 347
METRIC RANK
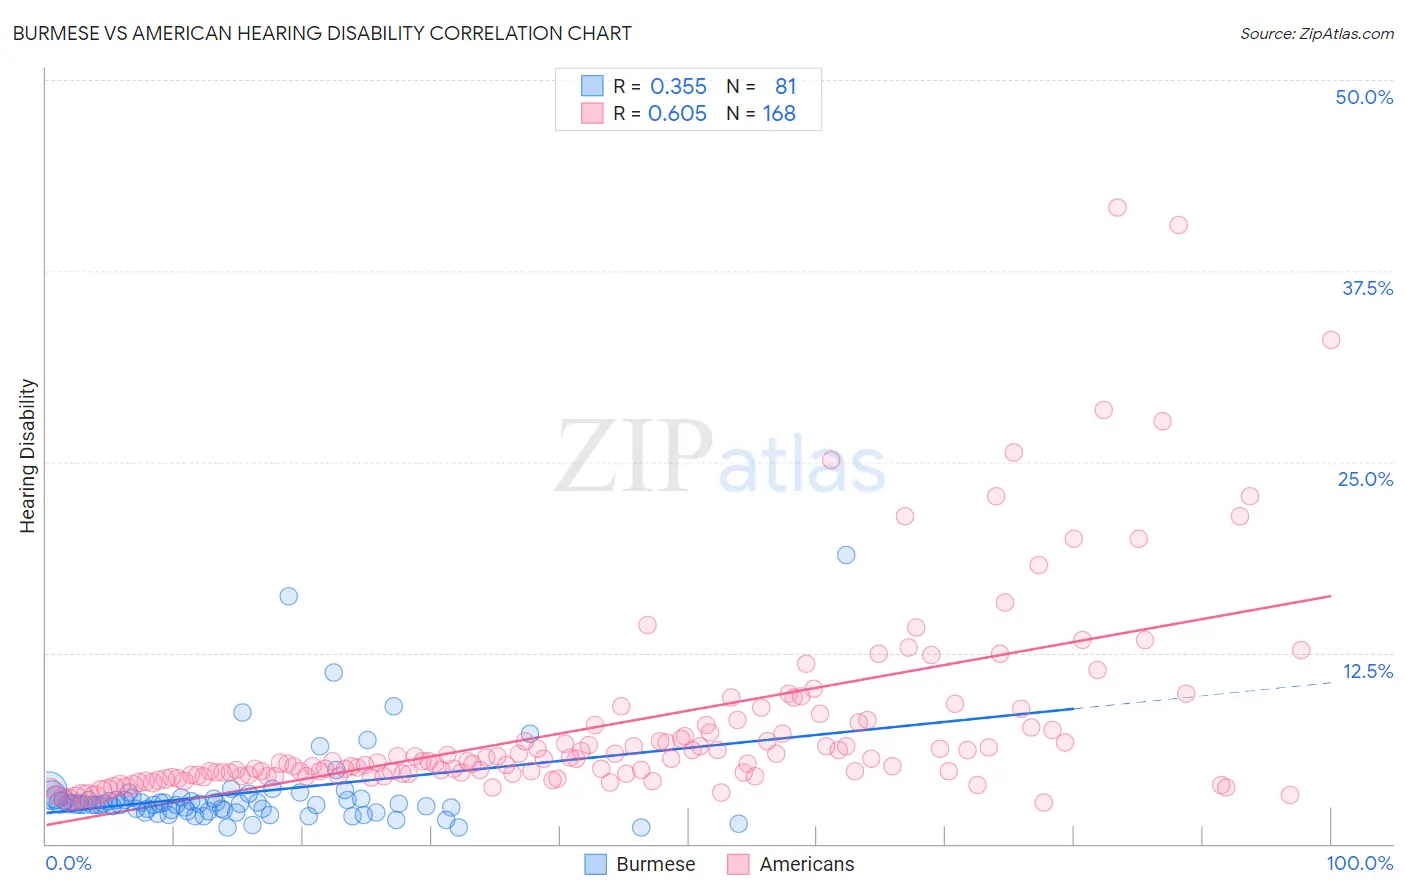
Burmese vs American Hearing Disability Correlation Chart
The statistical analysis conducted on geographies consisting of 465,070,150 people shows a mild positive correlation between the proportion of Burmese and percentage of population with hearing disability in the United States with a correlation coefficient (R) of 0.355 and weighted average of 2.8%. Similarly, the statistical analysis conducted on geographies consisting of 581,034,081 people shows a significant positive correlation between the proportion of Americans and percentage of population with hearing disability in the United States with a correlation coefficient (R) of 0.605 and weighted average of 3.9%, a difference of 39.1%.
Hearing Disability Correlation Summary
| Measurement | Burmese | American |
| Minimum | 1.0% | 2.7% |
| Maximum | 18.9% | 41.7% |
| Range | 17.8% | 38.9% |
| Mean | 3.3% | 7.7% |
| Median | 2.6% | 5.4% |
| Interquartile 25% (IQ1) | 2.2% | 4.5% |
| Interquartile 75% (IQ3) | 3.0% | 7.7% |
| Interquartile Range (IQR) | 0.80% | 3.2% |
| Standard Deviation (Sample) | 2.8% | 6.5% |
| Standard Deviation (Population) | 2.8% | 6.5% |
Similar Demographics by Hearing Disability
Demographics Similar to Burmese by Hearing Disability
In terms of hearing disability, the demographic groups most similar to Burmese are Moroccan (2.8%, a difference of 0.11%), Immigrants from Indonesia (2.8%, a difference of 0.27%), Taiwanese (2.8%, a difference of 0.32%), Immigrants from Spain (2.8%, a difference of 0.33%), and Honduran (2.8%, a difference of 0.35%).
| Demographics | Rating | Rank | Hearing Disability |
| Immigrants | Afghanistan | 95.3 /100 | #97 | Exceptional 2.8% |
| Immigrants | Honduras | 95.1 /100 | #98 | Exceptional 2.8% |
| Immigrants | Guatemala | 95.1 /100 | #99 | Exceptional 2.8% |
| Immigrants | Eastern Africa | 95.0 /100 | #100 | Exceptional 2.8% |
| Immigrants | Spain | 94.9 /100 | #101 | Exceptional 2.8% |
| Taiwanese | 94.8 /100 | #102 | Exceptional 2.8% |
| Immigrants | Indonesia | 94.7 /100 | #103 | Exceptional 2.8% |
| Burmese | 94.2 /100 | #104 | Exceptional 2.8% |
| Moroccans | 93.9 /100 | #105 | Exceptional 2.8% |
| Hondurans | 93.4 /100 | #106 | Exceptional 2.8% |
| Immigrants | Chile | 93.4 /100 | #107 | Exceptional 2.8% |
| Guatemalans | 93.2 /100 | #108 | Exceptional 2.8% |
| Turks | 93.0 /100 | #109 | Exceptional 2.8% |
| Cypriots | 92.9 /100 | #110 | Exceptional 2.8% |
| Immigrants | Yemen | 92.7 /100 | #111 | Exceptional 2.8% |
Demographics Similar to Americans by Hearing Disability
In terms of hearing disability, the demographic groups most similar to Americans are Cajun (3.9%, a difference of 1.1%), Hopi (3.9%, a difference of 1.2%), Cree (3.8%, a difference of 1.3%), Yakama (3.9%, a difference of 1.4%), and Puget Sound Salish (3.9%, a difference of 1.4%).
| Demographics | Rating | Rank | Hearing Disability |
| French | 0.0 /100 | #304 | Tragic 3.8% |
| English | 0.0 /100 | #305 | Tragic 3.8% |
| Marshallese | 0.0 /100 | #306 | Tragic 3.8% |
| French Canadians | 0.0 /100 | #307 | Tragic 3.8% |
| Ottawa | 0.0 /100 | #308 | Tragic 3.8% |
| Scotch-Irish | 0.0 /100 | #309 | Tragic 3.8% |
| Cree | 0.0 /100 | #310 | Tragic 3.8% |
| Americans | 0.0 /100 | #311 | Tragic 3.9% |
| Cajuns | 0.0 /100 | #312 | Tragic 3.9% |
| Hopi | 0.0 /100 | #313 | Tragic 3.9% |
| Yakama | 0.0 /100 | #314 | Tragic 3.9% |
| Puget Sound Salish | 0.0 /100 | #315 | Tragic 3.9% |
| Spanish Americans | 0.0 /100 | #316 | Tragic 4.0% |
| Comanche | 0.0 /100 | #317 | Tragic 4.0% |
| Cheyenne | 0.0 /100 | #318 | Tragic 4.0% |