Burmese vs Immigrants from Norway Hearing Disability
COMPARE
Burmese
Immigrants from Norway
Hearing Disability
Hearing Disability Comparison
Burmese
Immigrants from Norway
2.8%
HEARING DISABILITY
94.2/ 100
METRIC RATING
104th/ 347
METRIC RANK
3.2%
HEARING DISABILITY
7.3/ 100
METRIC RATING
216th/ 347
METRIC RANK
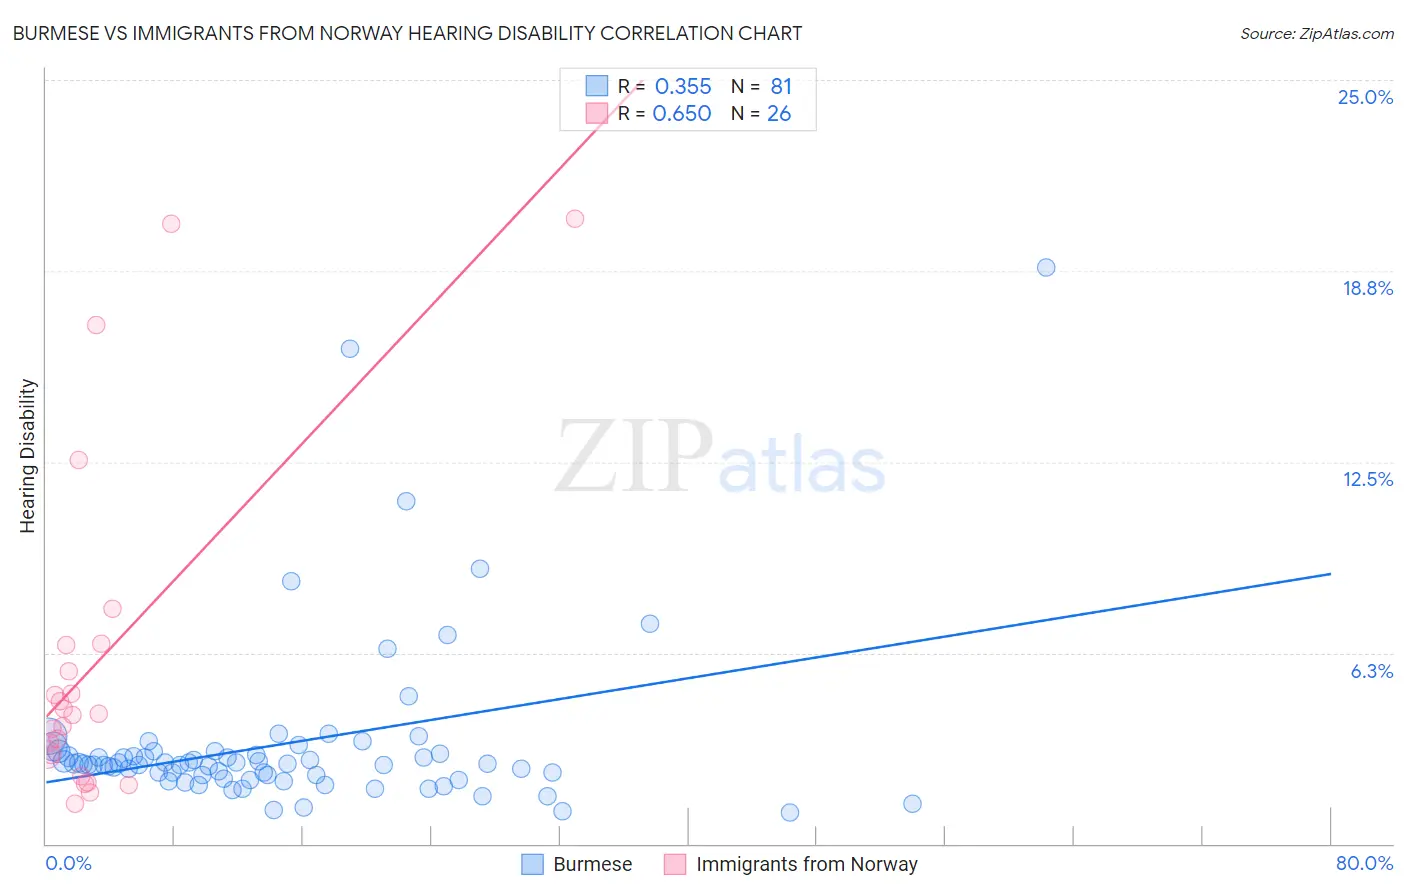
Burmese vs Immigrants from Norway Hearing Disability Correlation Chart
The statistical analysis conducted on geographies consisting of 465,070,150 people shows a mild positive correlation between the proportion of Burmese and percentage of population with hearing disability in the United States with a correlation coefficient (R) of 0.355 and weighted average of 2.8%. Similarly, the statistical analysis conducted on geographies consisting of 116,704,469 people shows a significant positive correlation between the proportion of Immigrants from Norway and percentage of population with hearing disability in the United States with a correlation coefficient (R) of 0.650 and weighted average of 3.2%, a difference of 13.4%.
Hearing Disability Correlation Summary
| Measurement | Burmese | Immigrants from Norway |
| Minimum | 1.0% | 1.3% |
| Maximum | 18.9% | 20.5% |
| Range | 17.8% | 19.1% |
| Mean | 3.3% | 6.0% |
| Median | 2.6% | 4.2% |
| Interquartile 25% (IQ1) | 2.2% | 2.9% |
| Interquartile 75% (IQ3) | 3.0% | 6.5% |
| Interquartile Range (IQR) | 0.80% | 3.6% |
| Standard Deviation (Sample) | 2.8% | 5.4% |
| Standard Deviation (Population) | 2.8% | 5.3% |
Similar Demographics by Hearing Disability
Demographics Similar to Burmese by Hearing Disability
In terms of hearing disability, the demographic groups most similar to Burmese are Moroccan (2.8%, a difference of 0.11%), Immigrants from Indonesia (2.8%, a difference of 0.27%), Taiwanese (2.8%, a difference of 0.32%), Immigrants from Spain (2.8%, a difference of 0.33%), and Honduran (2.8%, a difference of 0.35%).
| Demographics | Rating | Rank | Hearing Disability |
| Immigrants | Afghanistan | 95.3 /100 | #97 | Exceptional 2.8% |
| Immigrants | Honduras | 95.1 /100 | #98 | Exceptional 2.8% |
| Immigrants | Guatemala | 95.1 /100 | #99 | Exceptional 2.8% |
| Immigrants | Eastern Africa | 95.0 /100 | #100 | Exceptional 2.8% |
| Immigrants | Spain | 94.9 /100 | #101 | Exceptional 2.8% |
| Taiwanese | 94.8 /100 | #102 | Exceptional 2.8% |
| Immigrants | Indonesia | 94.7 /100 | #103 | Exceptional 2.8% |
| Burmese | 94.2 /100 | #104 | Exceptional 2.8% |
| Moroccans | 93.9 /100 | #105 | Exceptional 2.8% |
| Hondurans | 93.4 /100 | #106 | Exceptional 2.8% |
| Immigrants | Chile | 93.4 /100 | #107 | Exceptional 2.8% |
| Guatemalans | 93.2 /100 | #108 | Exceptional 2.8% |
| Turks | 93.0 /100 | #109 | Exceptional 2.8% |
| Cypriots | 92.9 /100 | #110 | Exceptional 2.8% |
| Immigrants | Yemen | 92.7 /100 | #111 | Exceptional 2.8% |
Demographics Similar to Immigrants from Norway by Hearing Disability
In terms of hearing disability, the demographic groups most similar to Immigrants from Norway are Russian (3.2%, a difference of 0.080%), Immigrants from Northern Europe (3.2%, a difference of 0.12%), New Zealander (3.2%, a difference of 0.17%), Bangladeshi (3.2%, a difference of 0.24%), and Malaysian (3.2%, a difference of 0.24%).
| Demographics | Rating | Rank | Hearing Disability |
| Immigrants | Hungary | 12.5 /100 | #209 | Poor 3.1% |
| Cape Verdeans | 12.2 /100 | #210 | Poor 3.1% |
| Romanians | 12.1 /100 | #211 | Poor 3.1% |
| Pakistanis | 11.1 /100 | #212 | Poor 3.1% |
| Immigrants | Iraq | 10.5 /100 | #213 | Poor 3.1% |
| Australians | 8.1 /100 | #214 | Tragic 3.2% |
| Bangladeshis | 8.1 /100 | #215 | Tragic 3.2% |
| Immigrants | Norway | 7.3 /100 | #216 | Tragic 3.2% |
| Russians | 7.1 /100 | #217 | Tragic 3.2% |
| Immigrants | Northern Europe | 7.0 /100 | #218 | Tragic 3.2% |
| New Zealanders | 6.8 /100 | #219 | Tragic 3.2% |
| Malaysians | 6.6 /100 | #220 | Tragic 3.2% |
| Immigrants | Laos | 6.6 /100 | #221 | Tragic 3.2% |
| Immigrants | Oceania | 6.5 /100 | #222 | Tragic 3.2% |
| Mexicans | 5.6 /100 | #223 | Tragic 3.2% |