Greek vs Immigrants from Sri Lanka Hearing Disability
COMPARE
Greek
Immigrants from Sri Lanka
Hearing Disability
Hearing Disability Comparison
Greeks
Immigrants from Sri Lanka
3.2%
HEARING DISABILITY
3.2/ 100
METRIC RATING
230th/ 347
METRIC RANK
2.7%
HEARING DISABILITY
98.4/ 100
METRIC RATING
64th/ 347
METRIC RANK
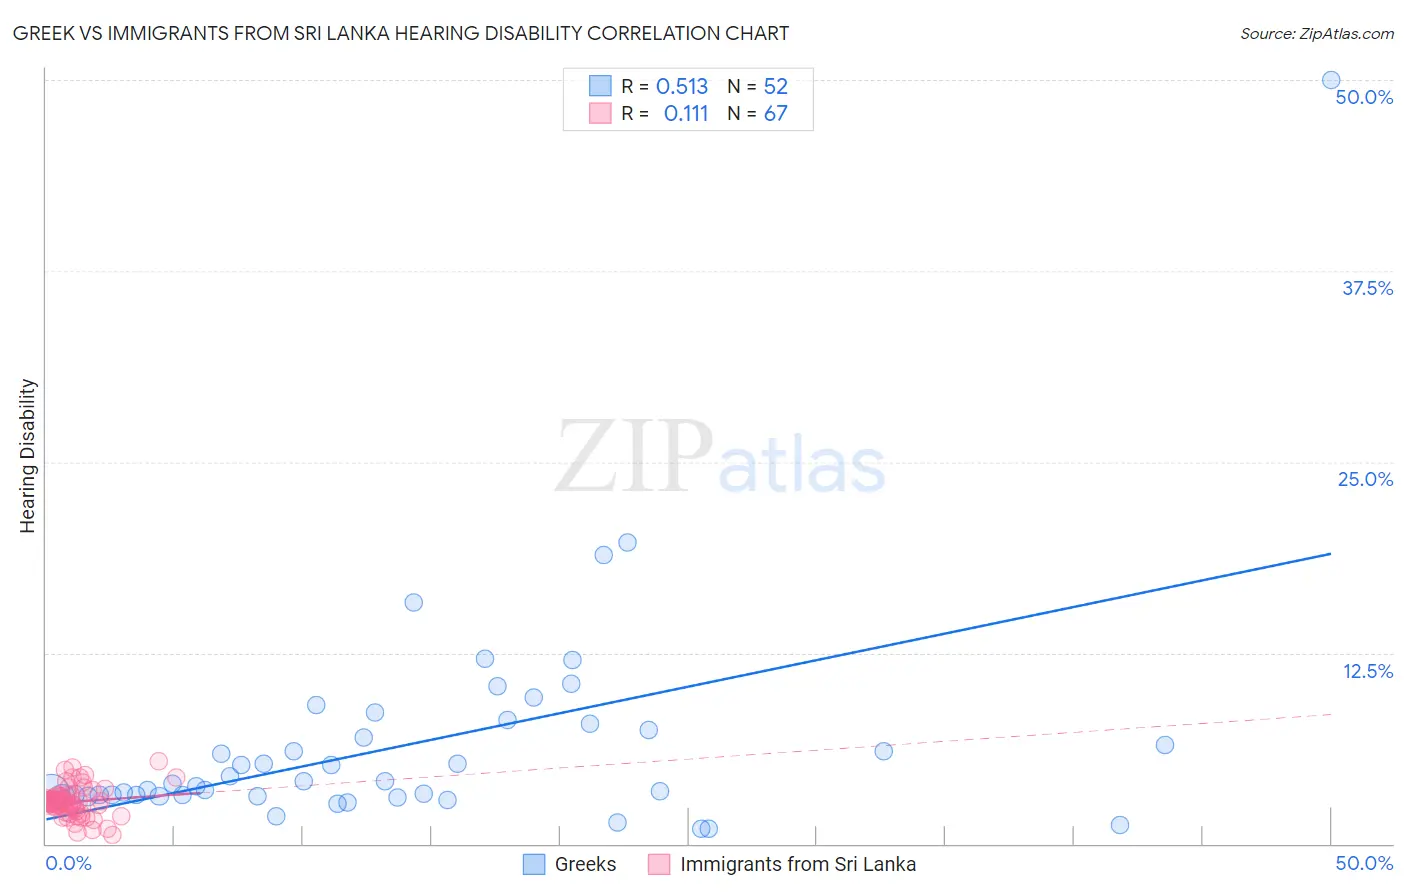
Greek vs Immigrants from Sri Lanka Hearing Disability Correlation Chart
The statistical analysis conducted on geographies consisting of 482,523,980 people shows a substantial positive correlation between the proportion of Greeks and percentage of population with hearing disability in the United States with a correlation coefficient (R) of 0.513 and weighted average of 3.2%. Similarly, the statistical analysis conducted on geographies consisting of 149,683,223 people shows a poor positive correlation between the proportion of Immigrants from Sri Lanka and percentage of population with hearing disability in the United States with a correlation coefficient (R) of 0.111 and weighted average of 2.7%, a difference of 19.4%.
Hearing Disability Correlation Summary
| Measurement | Greek | Immigrants from Sri Lanka |
| Minimum | 1.0% | 0.58% |
| Maximum | 50.0% | 5.4% |
| Range | 49.0% | 4.8% |
| Mean | 6.5% | 2.8% |
| Median | 4.0% | 2.7% |
| Interquartile 25% (IQ1) | 3.2% | 2.3% |
| Interquartile 75% (IQ3) | 7.6% | 3.1% |
| Interquartile Range (IQR) | 4.5% | 0.80% |
| Standard Deviation (Sample) | 7.4% | 0.97% |
| Standard Deviation (Population) | 7.4% | 0.97% |
Similar Demographics by Hearing Disability
Demographics Similar to Greeks by Hearing Disability
In terms of hearing disability, the demographic groups most similar to Greeks are Luxembourger (3.2%, a difference of 0.23%), Ukrainian (3.2%, a difference of 0.28%), Maltese (3.2%, a difference of 0.51%), Immigrants from Portugal (3.2%, a difference of 0.62%), and Estonian (3.3%, a difference of 0.65%).
| Demographics | Rating | Rank | Hearing Disability |
| Mexicans | 5.6 /100 | #223 | Tragic 3.2% |
| Icelanders | 5.2 /100 | #224 | Tragic 3.2% |
| Latvians | 5.1 /100 | #225 | Tragic 3.2% |
| Lebanese | 5.0 /100 | #226 | Tragic 3.2% |
| Bhutanese | 4.6 /100 | #227 | Tragic 3.2% |
| Immigrants | Portugal | 4.3 /100 | #228 | Tragic 3.2% |
| Maltese | 4.1 /100 | #229 | Tragic 3.2% |
| Greeks | 3.2 /100 | #230 | Tragic 3.2% |
| Luxembourgers | 2.9 /100 | #231 | Tragic 3.2% |
| Ukrainians | 2.9 /100 | #232 | Tragic 3.2% |
| Estonians | 2.4 /100 | #233 | Tragic 3.3% |
| Central American Indians | 2.3 /100 | #234 | Tragic 3.3% |
| Guamanians/Chamorros | 2.2 /100 | #235 | Tragic 3.3% |
| Serbians | 2.2 /100 | #236 | Tragic 3.3% |
| Immigrants | Austria | 1.8 /100 | #237 | Tragic 3.3% |
Demographics Similar to Immigrants from Sri Lanka by Hearing Disability
In terms of hearing disability, the demographic groups most similar to Immigrants from Sri Lanka are Indian (Asian) (2.7%, a difference of 0.050%), Immigrants from Nepal (2.7%, a difference of 0.080%), Immigrants from Uzbekistan (2.7%, a difference of 0.11%), Immigrants from Colombia (2.7%, a difference of 0.11%), and Immigrants from Belize (2.7%, a difference of 0.21%).
| Demographics | Rating | Rank | Hearing Disability |
| South Americans | 99.0 /100 | #57 | Exceptional 2.7% |
| Immigrants | Peru | 98.6 /100 | #58 | Exceptional 2.7% |
| Immigrants | Eritrea | 98.5 /100 | #59 | Exceptional 2.7% |
| Immigrants | Egypt | 98.5 /100 | #60 | Exceptional 2.7% |
| Immigrants | Uzbekistan | 98.4 /100 | #61 | Exceptional 2.7% |
| Immigrants | Colombia | 98.4 /100 | #62 | Exceptional 2.7% |
| Indians (Asian) | 98.4 /100 | #63 | Exceptional 2.7% |
| Immigrants | Sri Lanka | 98.4 /100 | #64 | Exceptional 2.7% |
| Immigrants | Nepal | 98.3 /100 | #65 | Exceptional 2.7% |
| Immigrants | Belize | 98.2 /100 | #66 | Exceptional 2.7% |
| Egyptians | 98.1 /100 | #67 | Exceptional 2.7% |
| Immigrants | Africa | 98.0 /100 | #68 | Exceptional 2.7% |
| Nicaraguans | 97.9 /100 | #69 | Exceptional 2.7% |
| Peruvians | 97.7 /100 | #70 | Exceptional 2.7% |
| Central Americans | 97.7 /100 | #71 | Exceptional 2.7% |