Burmese vs Immigrants from Fiji Hearing Disability
COMPARE
Burmese
Immigrants from Fiji
Hearing Disability
Hearing Disability Comparison
Burmese
Immigrants from Fiji
2.8%
HEARING DISABILITY
94.2/ 100
METRIC RATING
104th/ 347
METRIC RANK
2.9%
HEARING DISABILITY
67.1/ 100
METRIC RATING
160th/ 347
METRIC RANK
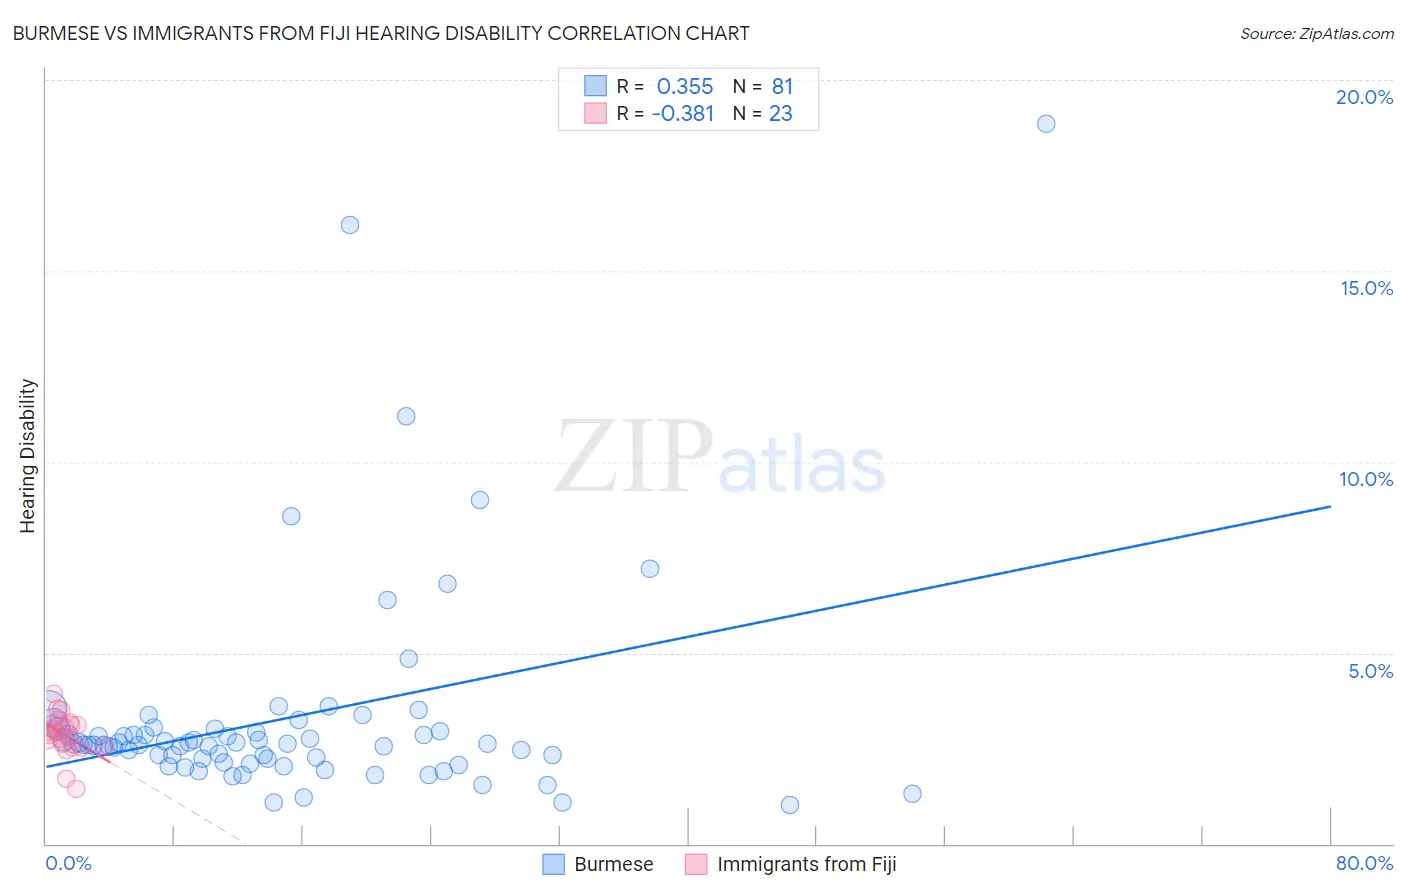
Burmese vs Immigrants from Fiji Hearing Disability Correlation Chart
The statistical analysis conducted on geographies consisting of 465,070,150 people shows a mild positive correlation between the proportion of Burmese and percentage of population with hearing disability in the United States with a correlation coefficient (R) of 0.355 and weighted average of 2.8%. Similarly, the statistical analysis conducted on geographies consisting of 93,738,910 people shows a mild negative correlation between the proportion of Immigrants from Fiji and percentage of population with hearing disability in the United States with a correlation coefficient (R) of -0.381 and weighted average of 2.9%, a difference of 5.2%.
Hearing Disability Correlation Summary
| Measurement | Burmese | Immigrants from Fiji |
| Minimum | 1.0% | 1.4% |
| Maximum | 18.9% | 3.9% |
| Range | 17.8% | 2.5% |
| Mean | 3.3% | 2.9% |
| Median | 2.6% | 2.9% |
| Interquartile 25% (IQ1) | 2.2% | 2.5% |
| Interquartile 75% (IQ3) | 3.0% | 3.2% |
| Interquartile Range (IQR) | 0.80% | 0.61% |
| Standard Deviation (Sample) | 2.8% | 0.54% |
| Standard Deviation (Population) | 2.8% | 0.53% |
Similar Demographics by Hearing Disability
Demographics Similar to Burmese by Hearing Disability
In terms of hearing disability, the demographic groups most similar to Burmese are Moroccan (2.8%, a difference of 0.11%), Immigrants from Indonesia (2.8%, a difference of 0.27%), Taiwanese (2.8%, a difference of 0.32%), Immigrants from Spain (2.8%, a difference of 0.33%), and Honduran (2.8%, a difference of 0.35%).
| Demographics | Rating | Rank | Hearing Disability |
| Immigrants | Afghanistan | 95.3 /100 | #97 | Exceptional 2.8% |
| Immigrants | Honduras | 95.1 /100 | #98 | Exceptional 2.8% |
| Immigrants | Guatemala | 95.1 /100 | #99 | Exceptional 2.8% |
| Immigrants | Eastern Africa | 95.0 /100 | #100 | Exceptional 2.8% |
| Immigrants | Spain | 94.9 /100 | #101 | Exceptional 2.8% |
| Taiwanese | 94.8 /100 | #102 | Exceptional 2.8% |
| Immigrants | Indonesia | 94.7 /100 | #103 | Exceptional 2.8% |
| Burmese | 94.2 /100 | #104 | Exceptional 2.8% |
| Moroccans | 93.9 /100 | #105 | Exceptional 2.8% |
| Hondurans | 93.4 /100 | #106 | Exceptional 2.8% |
| Immigrants | Chile | 93.4 /100 | #107 | Exceptional 2.8% |
| Guatemalans | 93.2 /100 | #108 | Exceptional 2.8% |
| Turks | 93.0 /100 | #109 | Exceptional 2.8% |
| Cypriots | 92.9 /100 | #110 | Exceptional 2.8% |
| Immigrants | Yemen | 92.7 /100 | #111 | Exceptional 2.8% |
Demographics Similar to Immigrants from Fiji by Hearing Disability
In terms of hearing disability, the demographic groups most similar to Immigrants from Fiji are Immigrants from Australia (2.9%, a difference of 0.020%), Albanian (2.9%, a difference of 0.060%), Immigrants from Japan (2.9%, a difference of 0.090%), Immigrants from Central America (3.0%, a difference of 0.24%), and Immigrants from Cambodia (3.0%, a difference of 0.25%).
| Demographics | Rating | Rank | Hearing Disability |
| Sudanese | 72.1 /100 | #153 | Good 2.9% |
| Immigrants | Lebanon | 71.5 /100 | #154 | Good 2.9% |
| Costa Ricans | 71.4 /100 | #155 | Good 2.9% |
| Immigrants | Poland | 70.2 /100 | #156 | Good 2.9% |
| Immigrants | Kazakhstan | 69.6 /100 | #157 | Good 2.9% |
| Immigrants | Burma/Myanmar | 69.5 /100 | #158 | Good 2.9% |
| Immigrants | Australia | 67.4 /100 | #159 | Good 2.9% |
| Immigrants | Fiji | 67.1 /100 | #160 | Good 2.9% |
| Albanians | 66.6 /100 | #161 | Good 2.9% |
| Immigrants | Japan | 66.3 /100 | #162 | Good 2.9% |
| Immigrants | Central America | 64.9 /100 | #163 | Good 3.0% |
| Immigrants | Cambodia | 64.8 /100 | #164 | Good 3.0% |
| Immigrants | Zimbabwe | 64.2 /100 | #165 | Good 3.0% |
| Immigrants | South Eastern Asia | 62.9 /100 | #166 | Good 3.0% |
| Immigrants | Eastern Europe | 58.1 /100 | #167 | Average 3.0% |