Burmese vs Immigrants from Albania Hearing Disability
COMPARE
Burmese
Immigrants from Albania
Hearing Disability
Hearing Disability Comparison
Burmese
Immigrants from Albania
2.8%
HEARING DISABILITY
94.2/ 100
METRIC RATING
104th/ 347
METRIC RANK
2.9%
HEARING DISABILITY
88.5/ 100
METRIC RATING
125th/ 347
METRIC RANK
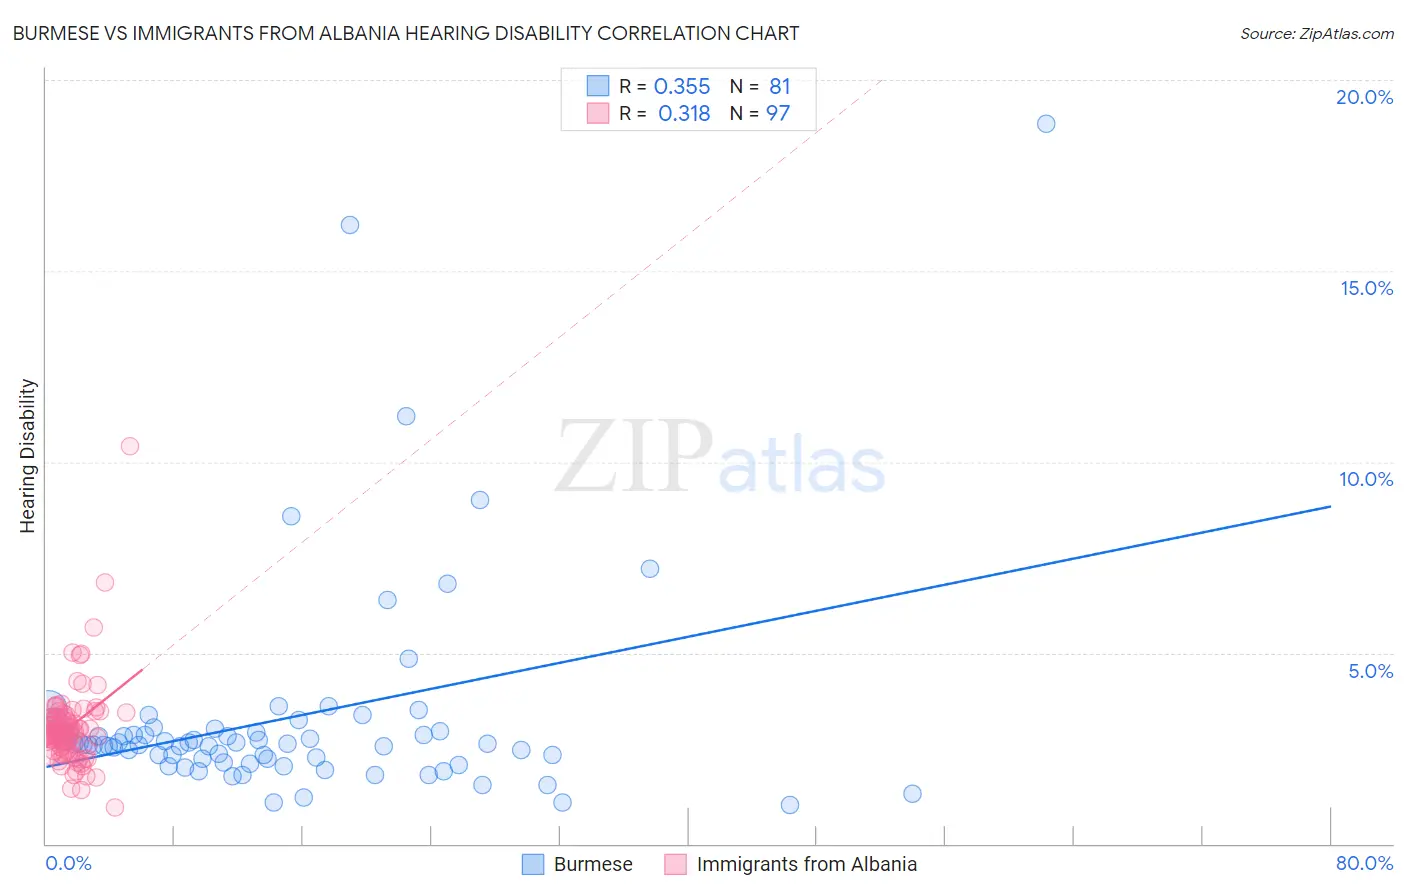
Burmese vs Immigrants from Albania Hearing Disability Correlation Chart
The statistical analysis conducted on geographies consisting of 465,070,150 people shows a mild positive correlation between the proportion of Burmese and percentage of population with hearing disability in the United States with a correlation coefficient (R) of 0.355 and weighted average of 2.8%. Similarly, the statistical analysis conducted on geographies consisting of 119,393,957 people shows a mild positive correlation between the proportion of Immigrants from Albania and percentage of population with hearing disability in the United States with a correlation coefficient (R) of 0.318 and weighted average of 2.9%, a difference of 1.9%.
Hearing Disability Correlation Summary
| Measurement | Burmese | Immigrants from Albania |
| Minimum | 1.0% | 0.95% |
| Maximum | 18.9% | 10.4% |
| Range | 17.8% | 9.5% |
| Mean | 3.3% | 3.0% |
| Median | 2.6% | 2.9% |
| Interquartile 25% (IQ1) | 2.2% | 2.5% |
| Interquartile 75% (IQ3) | 3.0% | 3.3% |
| Interquartile Range (IQR) | 0.80% | 0.85% |
| Standard Deviation (Sample) | 2.8% | 1.1% |
| Standard Deviation (Population) | 2.8% | 1.1% |
Similar Demographics by Hearing Disability
Demographics Similar to Burmese by Hearing Disability
In terms of hearing disability, the demographic groups most similar to Burmese are Moroccan (2.8%, a difference of 0.11%), Immigrants from Indonesia (2.8%, a difference of 0.27%), Taiwanese (2.8%, a difference of 0.32%), Immigrants from Spain (2.8%, a difference of 0.33%), and Honduran (2.8%, a difference of 0.35%).
| Demographics | Rating | Rank | Hearing Disability |
| Immigrants | Afghanistan | 95.3 /100 | #97 | Exceptional 2.8% |
| Immigrants | Honduras | 95.1 /100 | #98 | Exceptional 2.8% |
| Immigrants | Guatemala | 95.1 /100 | #99 | Exceptional 2.8% |
| Immigrants | Eastern Africa | 95.0 /100 | #100 | Exceptional 2.8% |
| Immigrants | Spain | 94.9 /100 | #101 | Exceptional 2.8% |
| Taiwanese | 94.8 /100 | #102 | Exceptional 2.8% |
| Immigrants | Indonesia | 94.7 /100 | #103 | Exceptional 2.8% |
| Burmese | 94.2 /100 | #104 | Exceptional 2.8% |
| Moroccans | 93.9 /100 | #105 | Exceptional 2.8% |
| Hondurans | 93.4 /100 | #106 | Exceptional 2.8% |
| Immigrants | Chile | 93.4 /100 | #107 | Exceptional 2.8% |
| Guatemalans | 93.2 /100 | #108 | Exceptional 2.8% |
| Turks | 93.0 /100 | #109 | Exceptional 2.8% |
| Cypriots | 92.9 /100 | #110 | Exceptional 2.8% |
| Immigrants | Yemen | 92.7 /100 | #111 | Exceptional 2.8% |
Demographics Similar to Immigrants from Albania by Hearing Disability
In terms of hearing disability, the demographic groups most similar to Immigrants from Albania are Immigrants from Zaire (2.9%, a difference of 0.030%), Bahamian (2.9%, a difference of 0.030%), Liberian (2.8%, a difference of 0.13%), Immigrants from Sudan (2.9%, a difference of 0.16%), and Cuban (2.8%, a difference of 0.22%).
| Demographics | Rating | Rank | Hearing Disability |
| Zimbabweans | 89.9 /100 | #118 | Excellent 2.8% |
| Kenyans | 89.8 /100 | #119 | Excellent 2.8% |
| Jordanians | 89.5 /100 | #120 | Excellent 2.8% |
| Cubans | 89.4 /100 | #121 | Excellent 2.8% |
| Liberians | 89.0 /100 | #122 | Excellent 2.8% |
| Immigrants | Zaire | 88.6 /100 | #123 | Excellent 2.9% |
| Bahamians | 88.6 /100 | #124 | Excellent 2.9% |
| Immigrants | Albania | 88.5 /100 | #125 | Excellent 2.9% |
| Immigrants | Sudan | 87.8 /100 | #126 | Excellent 2.9% |
| South American Indians | 86.9 /100 | #127 | Excellent 2.9% |
| Immigrants | Western Asia | 86.9 /100 | #128 | Excellent 2.9% |
| Immigrants | Uganda | 86.6 /100 | #129 | Excellent 2.9% |
| Immigrants | Vietnam | 86.5 /100 | #130 | Excellent 2.9% |
| Immigrants | Kenya | 86.1 /100 | #131 | Excellent 2.9% |
| Chileans | 85.8 /100 | #132 | Excellent 2.9% |