Burmese vs Immigrants from Norway 11th Grade

COMPARE

Burmese
Race
Ancestry
AfghanAfricanAlaska NativeAlaskan AthabascanAlbanianAleutAlsatianAmericanApacheArabArapahoArgentineanArmenianAssyrian/Chaldean/SyriacAustralianAustrianBahamianBangladeshiBarbadianBasqueBelgianBelizeanBermudanBhutaneseBlackfeetBolivianBrazilianBritishBritish West IndianBulgarianBurmeseCajunCambodianCanadianCape VerdeanCarpatho RusynCelticCentral AmericanCentral American IndianCherokeeCheyenneChickasawChileanChineseChippewaChoctawColombianColvilleComancheCosta RicanCreeCreekCroatianCrowCubanCypriotCzechCzechoslovakianDanishDelawareDominicanDutchDutch West IndianEastern EuropeanEcuadorianEgyptianEnglishEstonianEthiopianEuropeanFijianFilipinoFinnishFrenchFrench American IndianFrench CanadianGermanGerman RussianGhanaianGreekGuamanian/ChamorroGuatemalanGuyaneseHaitianHmongHonduranHopiHoumaHungarianIcelanderIndian (Asian)IndonesianInupiatIranianIraqiIrishIroquoisIsraeliItalianJamaicanJapaneseJordanianKenyanKiowaKoreanLaotianLatvianLebaneseLiberianLithuanianLumbeeLuxembourgerMacedonianMalaysianMalteseMarshalleseMenomineeMexicanMexican American IndianMongolianMoroccanNative HawaiianNavajoNepaleseNew ZealanderNicaraguanNigerianNorthern EuropeanNorwegianOkinawanOsageOttawaPaiutePakistaniPalestinianPanamanianParaguayanPennsylvania GermanPeruvianPimaPolishPortuguesePotawatomiPuebloPuerto RicanPuget Sound SalishRomanianRussianSalvadoranSamoanScandinavianScotch-IrishScottishSeminoleSenegaleseSerbianShoshoneSierra LeoneanSiouxSlavicSlovakSloveneSomaliSouth AfricanSouth AmericanSouth American IndianSoviet UnionSpaniardSpanishSpanish AmericanSpanish American IndianSri LankanSubsaharan AfricanSudaneseSwedishSwissSyrianTaiwaneseThaiTlingit-HaidaTohono O'OdhamTonganTrinidadian and TobagonianTsimshianTurkishU.S. Virgin IslanderUgandanUkrainianUruguayanUteVenezuelanVietnameseWelshWest IndianYakamaYaquiYugoslavianYumanYup'ikZimbabwean
Immigration
NonimmigrantsImmigrantsAfghanistanAfricaAlbaniaArgentinaArmeniaAsiaAustraliaAustriaBahamasBangladeshBarbadosBelarusBelgiumBelizeBoliviaBosnia and HerzegovinaBrazilBulgariaBurma/MyanmarCabo VerdeCambodiaCameroonCanadaCaribbeanCentral AmericaChileChinaColombiaCongoCosta RicaCroatiaCubaCzechoslovakiaDenmarkDominicaDominican RepublicEastern AfricaEastern AsiaEastern EuropeEcuadorEgyptEl SalvadorEnglandEritreaEthiopiaEuropeFijiFranceGermanyGhanaGreeceGrenadaGuatemalaGuyanaHaitiHondurasHong KongHungaryIndiaIndonesiaIranIraqIrelandIsraelItalyJamaicaJapanJordanKazakhstanKenyaKoreaKuwaitLaosLatin AmericaLatviaLebanonLiberiaLithuaniaMalaysiaMexicoMicronesiaMiddle AfricaMoldovaMoroccoNepalNetherlandsNicaraguaNigeriaNorth AmericaNorth MacedoniaNorthern AfricaNorthern EuropeOceaniaPakistanPanamaPeruPhilippinesPolandPortugalRomaniaRussiaSaudi ArabiaScotlandSenegalSerbiaSierra LeoneSingaporeSomaliaSouth AfricaSouth AmericaSouth Central AsiaSouth Eastern AsiaSouthern EuropeSpainSri LankaSt. Vincent and the GrenadinesSudanSwedenSwitzerlandSyriaTaiwanThailandTrinidad and TobagoTurkeyUgandaUkraineUruguayUzbekistanVenezuelaVietnamWest IndiesWestern AfricaWestern AsiaWestern EuropeYemenZaireZimbabweAzores
Immigrants from Norway
Race
Ancestry
AfghanAfricanAlaska NativeAlaskan AthabascanAlbanianAleutAlsatianAmericanApacheArabArapahoArgentineanArmenianAssyrian/Chaldean/SyriacAustralianAustrianBahamianBangladeshiBarbadianBasqueBelgianBelizeanBermudanBhutaneseBlackfeetBolivianBrazilianBritishBritish West IndianBulgarianCajunCambodianCanadianCape VerdeanCarpatho RusynCelticCentral AmericanCentral American IndianCherokeeCheyenneChickasawChileanChineseChippewaChoctawColombianColvilleComancheCosta RicanCreeCreekCroatianCrowCubanCypriotCzechCzechoslovakianDanishDelawareDominicanDutchDutch West IndianEastern EuropeanEcuadorianEgyptianEnglishEstonianEthiopianEuropeanFijianFilipinoFinnishFrenchFrench American IndianFrench CanadianGermanGerman RussianGhanaianGreekGuamanian/ChamorroGuatemalanGuyaneseHaitianHmongHonduranHopiHoumaHungarianIcelanderIndian (Asian)IndonesianInupiatIranianIraqiIrishIroquoisIsraeliItalianJamaicanJapaneseJordanianKenyanKiowaKoreanLaotianLatvianLebaneseLiberianLithuanianLumbeeLuxembourgerMacedonianMalaysianMalteseMarshalleseMenomineeMexicanMexican American IndianMongolianMoroccanNative HawaiianNavajoNepaleseNew ZealanderNicaraguanNigerianNorthern EuropeanNorwegianOkinawanOsageOttawaPaiutePakistaniPalestinianPanamanianParaguayanPennsylvania GermanPeruvianPimaPolishPortuguesePotawatomiPuebloPuerto RicanPuget Sound SalishRomanianRussianSalvadoranSamoanScandinavianScotch-IrishScottishSeminoleSenegaleseSerbianShoshoneSierra LeoneanSiouxSlavicSlovakSloveneSomaliSouth AfricanSouth AmericanSouth American IndianSoviet UnionSpaniardSpanishSpanish AmericanSpanish American IndianSri LankanSubsaharan AfricanSudaneseSwedishSwissSyrianTaiwaneseThaiTlingit-HaidaTohono O'OdhamTonganTrinidadian and TobagonianTsimshianTurkishU.S. Virgin IslanderUgandanUkrainianUruguayanUteVenezuelanVietnameseWelshWest IndianYakamaYaquiYugoslavianYumanYup'ikZimbabwean
Immigration
NonimmigrantsImmigrantsAfghanistanAfricaAlbaniaArgentinaArmeniaAsiaAustraliaAustriaBahamasBangladeshBarbadosBelarusBelgiumBelizeBoliviaBosnia and HerzegovinaBrazilBulgariaBurma/MyanmarCabo VerdeCambodiaCameroonCanadaCaribbeanCentral AmericaChileChinaColombiaCongoCosta RicaCroatiaCubaCzechoslovakiaDenmarkDominicaDominican RepublicEastern AfricaEastern AsiaEastern EuropeEcuadorEgyptEl SalvadorEnglandEritreaEthiopiaEuropeFijiFranceGermanyGhanaGreeceGrenadaGuatemalaGuyanaHaitiHondurasHong KongHungaryIndiaIndonesiaIranIraqIrelandIsraelItalyJamaicaJapanJordanKazakhstanKenyaKoreaKuwaitLaosLatin AmericaLatviaLebanonLiberiaLithuaniaMalaysiaMexicoMicronesiaMiddle AfricaMoldovaMoroccoNepalNetherlandsNicaraguaNigeriaNorth AmericaNorth MacedoniaNorthern AfricaNorthern EuropeNorwayOceaniaPakistanPanamaPeruPhilippinesPolandPortugalRomaniaRussiaSaudi ArabiaScotlandSenegalSerbiaSierra LeoneSingaporeSomaliaSouth AfricaSouth AmericaSouth Central AsiaSouth Eastern AsiaSouthern EuropeSpainSri LankaSt. Vincent and the GrenadinesSudanSwedenSwitzerlandSyriaTaiwanThailandTrinidad and TobagoTurkeyUgandaUkraineUruguayUzbekistanVenezuelaVietnamWest IndiesWestern AfricaWestern AsiaWestern EuropeYemenZaireZimbabweAzores
11th Grade
Income
Poverty
Unemployment
Labor Participation
Family Structure
Vehicle Availability
Education Level
Disability

11th Grade Comparison

Burmese

Immigrants from Norway

Exceptional
Exceptional
93.6%
11TH GRADE
99.2/ 100
METRIC RATING
89th/ 347
METRIC RANK
93.5%
11TH GRADE
98.4/ 100
METRIC RATING
107th/ 347
METRIC RANK

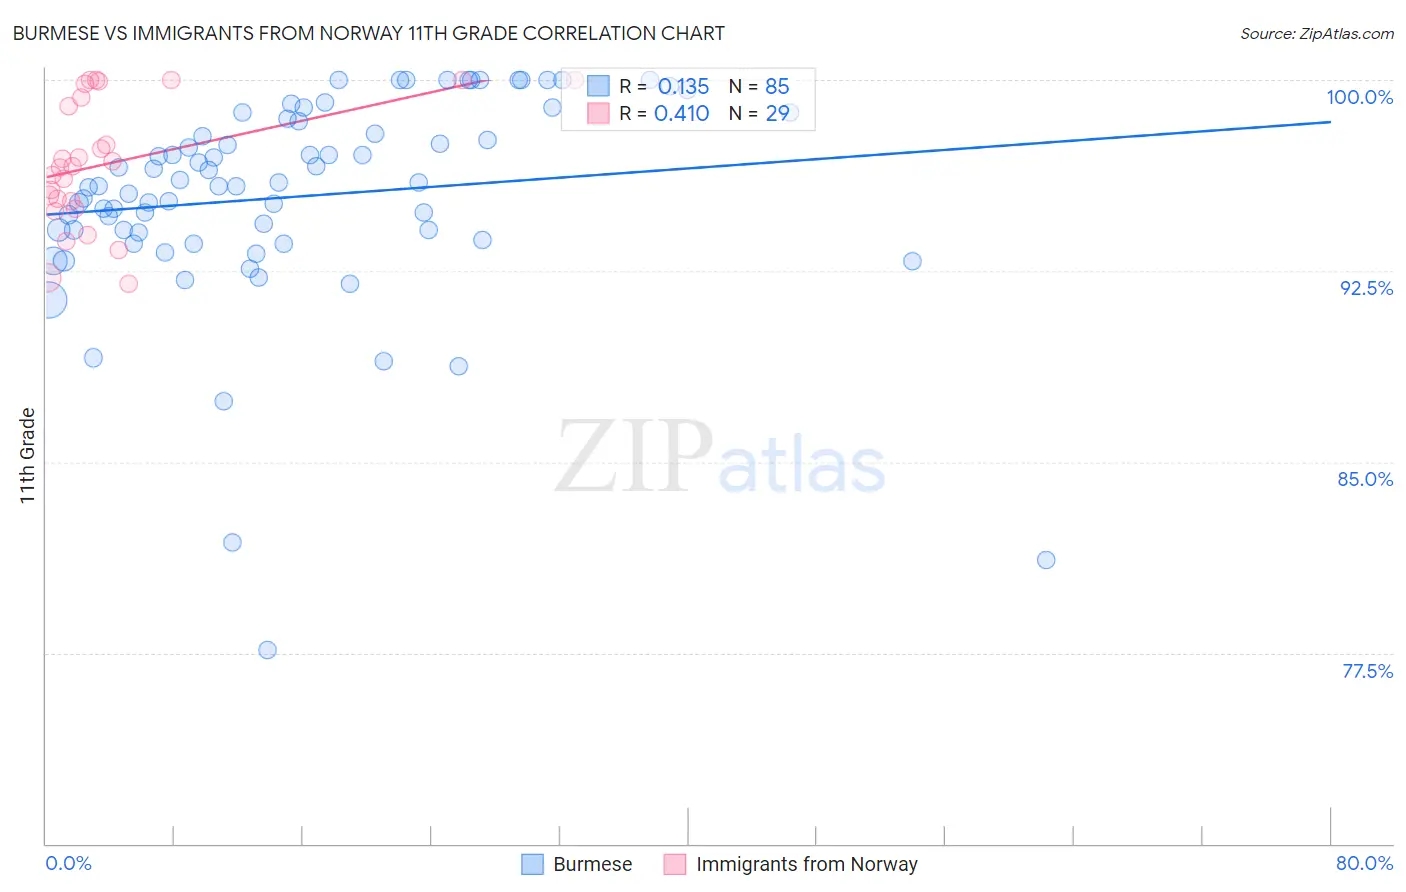
Burmese vs Immigrants from Norway 11th Grade Correlation Chart

The statistical analysis conducted on geographies consisting of 465,370,495 people shows a poor positive correlation between the proportion of Burmese and percentage of population with at least 11th grade education in the United States with a correlation coefficient (R) of 0.135 and weighted average of 93.6%. Similarly, the statistical analysis conducted on geographies consisting of 116,716,420 people shows a moderate positive correlation between the proportion of Immigrants from Norway and percentage of population with at least 11th grade education in the United States with a correlation coefficient (R) of 0.410 and weighted average of 93.5%, a difference of 0.17%.
Burmese vs Immigrants from Norway 11th Grade

11th Grade Correlation Summary

MeasurementBurmeseImmigrants from Norway
Minimum77.6%92.0%
Maximum100.0%100.0%
Range22.4%8.0%
Mean95.4%96.8%
Median95.8%96.6%
Interquartile 25% (IQ1)93.9%95.1%
Interquartile 75% (IQ3)98.4%99.6%
Interquartile Range (IQR)4.6%4.5%
Standard Deviation (Sample)4.1%2.5%
Standard Deviation (Population)4.1%2.4%

Demographics Similar to Burmese and Immigrants from Norway by 11th Grade

In terms of 11th grade, the demographic groups most similar to Burmese are Cambodian (93.6%, a difference of 0.0%), Ottawa (93.6%, a difference of 0.010%), South African (93.6%, a difference of 0.020%), Immigrants from Bulgaria (93.6%, a difference of 0.030%), and Puget Sound Salish (93.6%, a difference of 0.050%). Similarly, the demographic groups most similar to Immigrants from Norway are Alaska Native (93.5%, a difference of 0.0%), Lebanese (93.5%, a difference of 0.020%), Immigrants from Europe (93.5%, a difference of 0.020%), Immigrants from Serbia (93.5%, a difference of 0.020%), and Immigrants from Croatia (93.5%, a difference of 0.020%).
DemographicsRating | Rank11th Grade
Cambodians
99.2
/100
|
#88
Exceptional
93.6%
Burmese
99.2
/100
|
#89
Exceptional
93.6%
Ottawa
99.2
/100
|
#90
Exceptional
93.6%
South Africans
99.2
/100
|
#91
Exceptional
93.6%
Immigrants | Bulgaria
99.1
/100
|
#92
Exceptional
93.6%
Puget Sound Salish
99.1
/100
|
#93
Exceptional
93.6%
Swiss
99.0
/100
|
#94
Exceptional
93.6%
Immigrants | France
99.0
/100
|
#95
Exceptional
93.6%
Immigrants | Turkey
98.9
/100
|
#96
Exceptional
93.5%
Immigrants | Iran
98.9
/100
|
#97
Exceptional
93.5%
Immigrants | Israel
98.8
/100
|
#98
Exceptional
93.5%
Menominee
98.7
/100
|
#99
Exceptional
93.5%
Immigrants | North Macedonia
98.7
/100
|
#100
Exceptional
93.5%
Immigrants | Romania
98.7
/100
|
#101
Exceptional
93.5%
Chippewa
98.6
/100
|
#102
Exceptional
93.5%
Lebanese
98.6
/100
|
#103
Exceptional
93.5%
Immigrants | Europe
98.6
/100
|
#104
Exceptional
93.5%
Immigrants | Serbia
98.6
/100
|
#105
Exceptional
93.5%
Immigrants | Croatia
98.6
/100
|
#106
Exceptional
93.5%
Immigrants | Norway
98.4
/100
|
#107
Exceptional
93.5%
Alaska Natives
98.4
/100
|
#108
Exceptional
93.5%