Fijian vs Immigrants from Norway Hearing Disability
COMPARE
Fijian
Immigrants from Norway
Hearing Disability
Hearing Disability Comparison
Fijians
Immigrants from Norway
3.5%
HEARING DISABILITY
0.0/ 100
METRIC RATING
272nd/ 347
METRIC RANK
3.2%
HEARING DISABILITY
7.3/ 100
METRIC RATING
216th/ 347
METRIC RANK
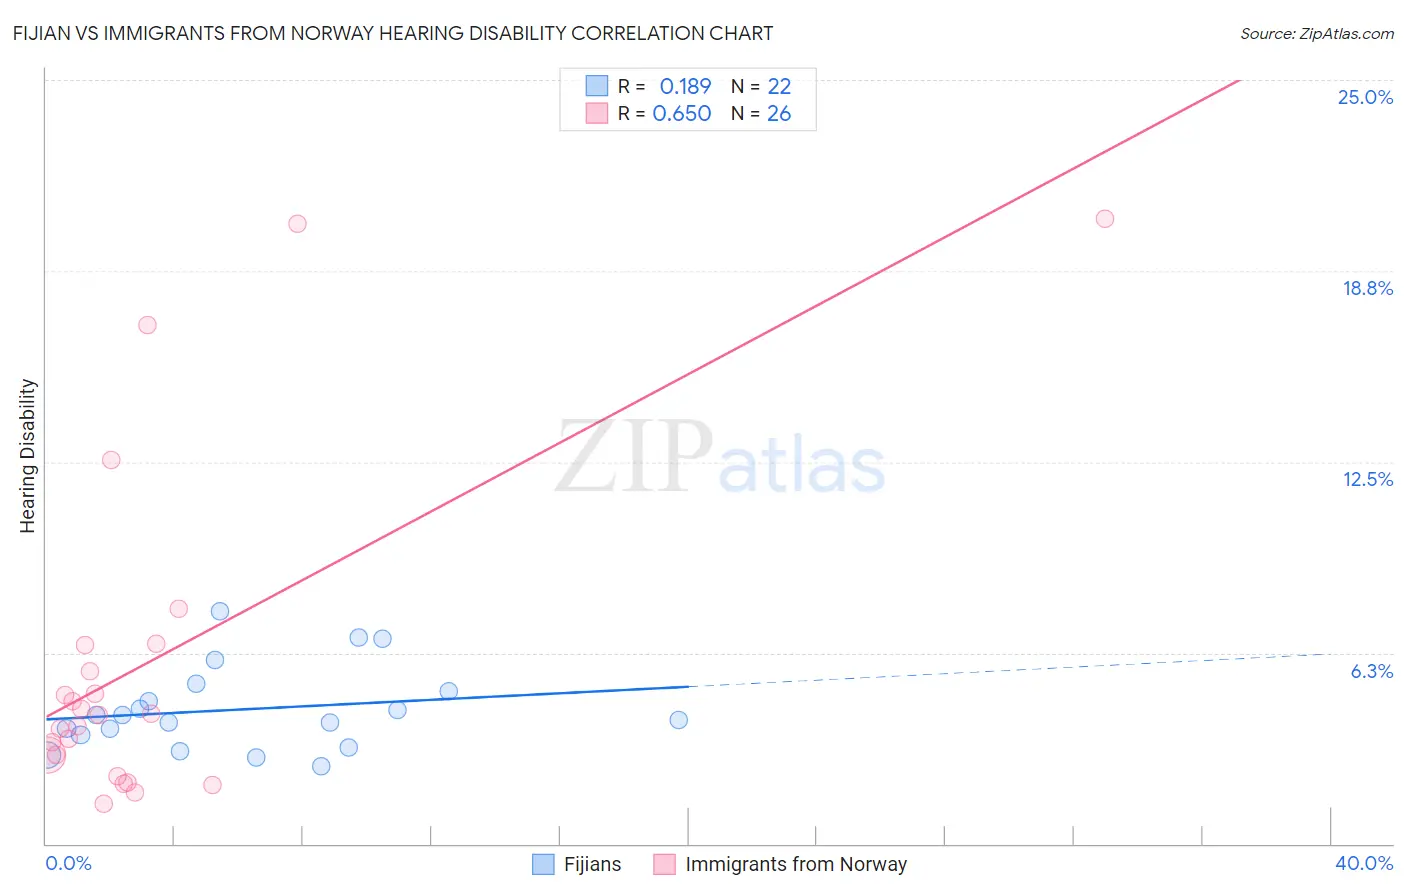
Fijian vs Immigrants from Norway Hearing Disability Correlation Chart
The statistical analysis conducted on geographies consisting of 55,946,313 people shows a poor positive correlation between the proportion of Fijians and percentage of population with hearing disability in the United States with a correlation coefficient (R) of 0.189 and weighted average of 3.5%. Similarly, the statistical analysis conducted on geographies consisting of 116,704,469 people shows a significant positive correlation between the proportion of Immigrants from Norway and percentage of population with hearing disability in the United States with a correlation coefficient (R) of 0.650 and weighted average of 3.2%, a difference of 11.2%.
Hearing Disability Correlation Summary
| Measurement | Fijian | Immigrants from Norway |
| Minimum | 2.5% | 1.3% |
| Maximum | 7.6% | 20.5% |
| Range | 5.1% | 19.1% |
| Mean | 4.4% | 6.0% |
| Median | 4.1% | 4.2% |
| Interquartile 25% (IQ1) | 3.6% | 2.9% |
| Interquartile 75% (IQ3) | 5.0% | 6.5% |
| Interquartile Range (IQR) | 1.4% | 3.6% |
| Standard Deviation (Sample) | 1.4% | 5.4% |
| Standard Deviation (Population) | 1.3% | 5.3% |
Similar Demographics by Hearing Disability
Demographics Similar to Fijians by Hearing Disability
In terms of hearing disability, the demographic groups most similar to Fijians are Puerto Rican (3.5%, a difference of 0.070%), Czech (3.5%, a difference of 0.26%), Swiss (3.5%, a difference of 0.39%), European (3.5%, a difference of 0.52%), and Czechoslovakian (3.6%, a difference of 0.60%).
| Demographics | Rating | Rank | Hearing Disability |
| British | 0.1 /100 | #265 | Tragic 3.5% |
| Belgians | 0.1 /100 | #266 | Tragic 3.5% |
| Canadians | 0.1 /100 | #267 | Tragic 3.5% |
| Spaniards | 0.1 /100 | #268 | Tragic 3.5% |
| Ute | 0.1 /100 | #269 | Tragic 3.5% |
| Europeans | 0.1 /100 | #270 | Tragic 3.5% |
| Czechs | 0.1 /100 | #271 | Tragic 3.5% |
| Fijians | 0.0 /100 | #272 | Tragic 3.5% |
| Puerto Ricans | 0.0 /100 | #273 | Tragic 3.5% |
| Swiss | 0.0 /100 | #274 | Tragic 3.5% |
| Czechoslovakians | 0.0 /100 | #275 | Tragic 3.6% |
| Danes | 0.0 /100 | #276 | Tragic 3.6% |
| Immigrants | Nonimmigrants | 0.0 /100 | #277 | Tragic 3.6% |
| Basques | 0.0 /100 | #278 | Tragic 3.6% |
| Slovaks | 0.0 /100 | #279 | Tragic 3.6% |
Demographics Similar to Immigrants from Norway by Hearing Disability
In terms of hearing disability, the demographic groups most similar to Immigrants from Norway are Russian (3.2%, a difference of 0.080%), Immigrants from Northern Europe (3.2%, a difference of 0.12%), New Zealander (3.2%, a difference of 0.17%), Bangladeshi (3.2%, a difference of 0.24%), and Malaysian (3.2%, a difference of 0.24%).
| Demographics | Rating | Rank | Hearing Disability |
| Immigrants | Hungary | 12.5 /100 | #209 | Poor 3.1% |
| Cape Verdeans | 12.2 /100 | #210 | Poor 3.1% |
| Romanians | 12.1 /100 | #211 | Poor 3.1% |
| Pakistanis | 11.1 /100 | #212 | Poor 3.1% |
| Immigrants | Iraq | 10.5 /100 | #213 | Poor 3.1% |
| Australians | 8.1 /100 | #214 | Tragic 3.2% |
| Bangladeshis | 8.1 /100 | #215 | Tragic 3.2% |
| Immigrants | Norway | 7.3 /100 | #216 | Tragic 3.2% |
| Russians | 7.1 /100 | #217 | Tragic 3.2% |
| Immigrants | Northern Europe | 7.0 /100 | #218 | Tragic 3.2% |
| New Zealanders | 6.8 /100 | #219 | Tragic 3.2% |
| Malaysians | 6.6 /100 | #220 | Tragic 3.2% |
| Immigrants | Laos | 6.6 /100 | #221 | Tragic 3.2% |
| Immigrants | Oceania | 6.5 /100 | #222 | Tragic 3.2% |
| Mexicans | 5.6 /100 | #223 | Tragic 3.2% |