Arab vs Immigrants from Norway Hearing Disability
COMPARE
Arab
Immigrants from Norway
Hearing Disability
Hearing Disability Comparison
Arabs
Immigrants from Norway
3.0%
HEARING DISABILITY
57.6/ 100
METRIC RATING
169th/ 347
METRIC RANK
3.2%
HEARING DISABILITY
7.3/ 100
METRIC RATING
216th/ 347
METRIC RANK
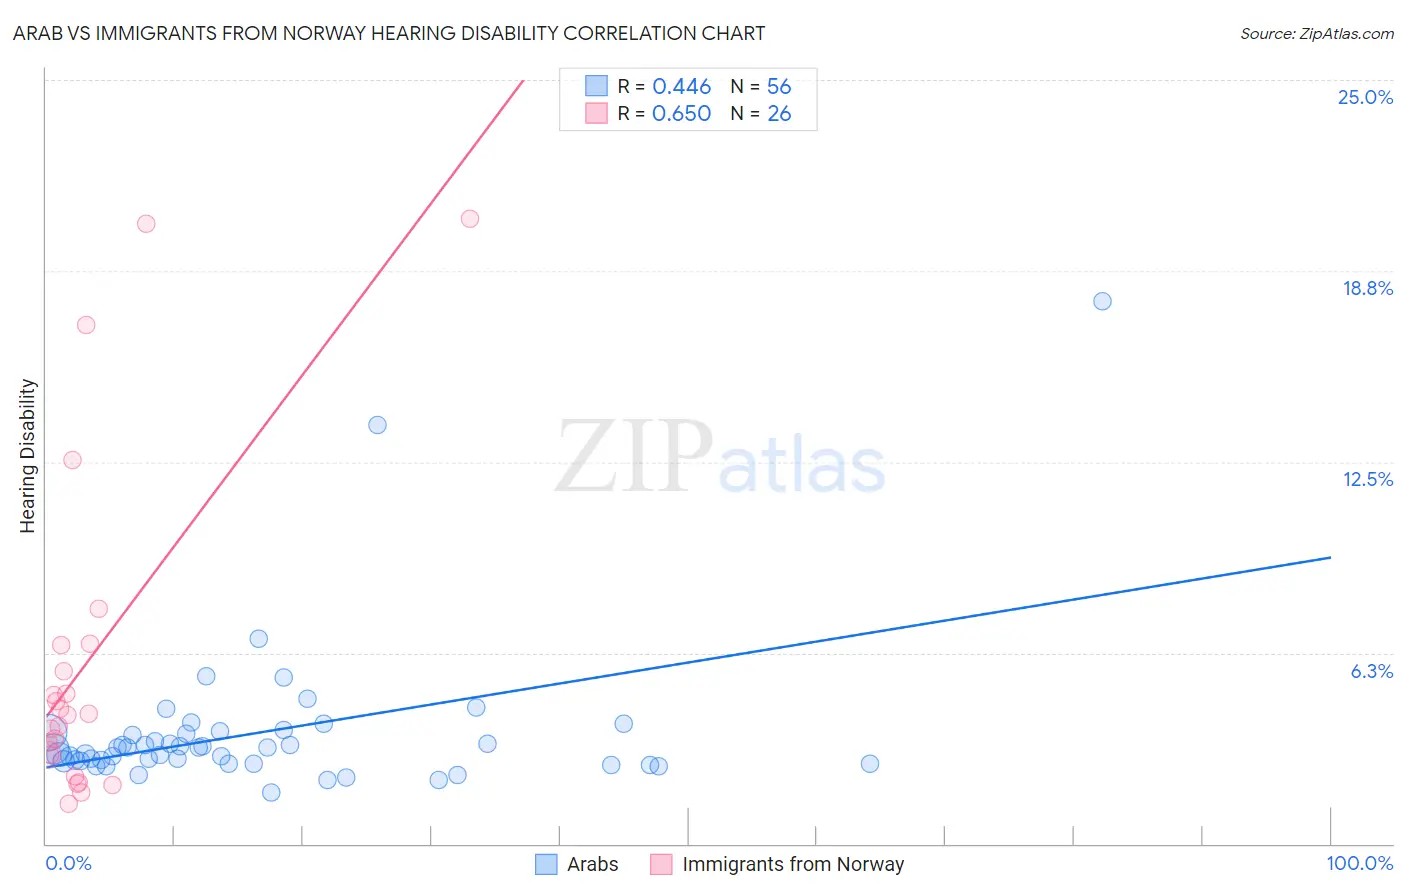
Arab vs Immigrants from Norway Hearing Disability Correlation Chart
The statistical analysis conducted on geographies consisting of 486,579,834 people shows a moderate positive correlation between the proportion of Arabs and percentage of population with hearing disability in the United States with a correlation coefficient (R) of 0.446 and weighted average of 3.0%. Similarly, the statistical analysis conducted on geographies consisting of 116,704,469 people shows a significant positive correlation between the proportion of Immigrants from Norway and percentage of population with hearing disability in the United States with a correlation coefficient (R) of 0.650 and weighted average of 3.2%, a difference of 6.7%.
Hearing Disability Correlation Summary
| Measurement | Arab | Immigrants from Norway |
| Minimum | 1.7% | 1.3% |
| Maximum | 17.8% | 20.5% |
| Range | 16.1% | 19.1% |
| Mean | 3.6% | 6.0% |
| Median | 3.1% | 4.2% |
| Interquartile 25% (IQ1) | 2.7% | 2.9% |
| Interquartile 75% (IQ3) | 3.6% | 6.5% |
| Interquartile Range (IQR) | 0.96% | 3.6% |
| Standard Deviation (Sample) | 2.5% | 5.4% |
| Standard Deviation (Population) | 2.5% | 5.3% |
Similar Demographics by Hearing Disability
Demographics Similar to Arabs by Hearing Disability
In terms of hearing disability, the demographic groups most similar to Arabs are Immigrants from Greece (3.0%, a difference of 0.030%), Immigrants from Eastern Europe (3.0%, a difference of 0.040%), Immigrants from Cabo Verde (3.0%, a difference of 0.070%), Immigrants from Ukraine (3.0%, a difference of 0.10%), and Armenian (3.0%, a difference of 0.15%).
| Demographics | Rating | Rank | Hearing Disability |
| Immigrants | Japan | 66.3 /100 | #162 | Good 2.9% |
| Immigrants | Central America | 64.9 /100 | #163 | Good 3.0% |
| Immigrants | Cambodia | 64.8 /100 | #164 | Good 3.0% |
| Immigrants | Zimbabwe | 64.2 /100 | #165 | Good 3.0% |
| Immigrants | South Eastern Asia | 62.9 /100 | #166 | Good 3.0% |
| Immigrants | Eastern Europe | 58.1 /100 | #167 | Average 3.0% |
| Immigrants | Greece | 57.9 /100 | #168 | Average 3.0% |
| Arabs | 57.6 /100 | #169 | Average 3.0% |
| Immigrants | Cabo Verde | 56.9 /100 | #170 | Average 3.0% |
| Immigrants | Ukraine | 56.6 /100 | #171 | Average 3.0% |
| Armenians | 56.0 /100 | #172 | Average 3.0% |
| Immigrants | Serbia | 51.1 /100 | #173 | Average 3.0% |
| Indonesians | 50.0 /100 | #174 | Average 3.0% |
| Immigrants | Romania | 48.4 /100 | #175 | Average 3.0% |
| Panamanians | 47.0 /100 | #176 | Average 3.0% |
Demographics Similar to Immigrants from Norway by Hearing Disability
In terms of hearing disability, the demographic groups most similar to Immigrants from Norway are Russian (3.2%, a difference of 0.080%), Immigrants from Northern Europe (3.2%, a difference of 0.12%), New Zealander (3.2%, a difference of 0.17%), Bangladeshi (3.2%, a difference of 0.24%), and Malaysian (3.2%, a difference of 0.24%).
| Demographics | Rating | Rank | Hearing Disability |
| Immigrants | Hungary | 12.5 /100 | #209 | Poor 3.1% |
| Cape Verdeans | 12.2 /100 | #210 | Poor 3.1% |
| Romanians | 12.1 /100 | #211 | Poor 3.1% |
| Pakistanis | 11.1 /100 | #212 | Poor 3.1% |
| Immigrants | Iraq | 10.5 /100 | #213 | Poor 3.1% |
| Australians | 8.1 /100 | #214 | Tragic 3.2% |
| Bangladeshis | 8.1 /100 | #215 | Tragic 3.2% |
| Immigrants | Norway | 7.3 /100 | #216 | Tragic 3.2% |
| Russians | 7.1 /100 | #217 | Tragic 3.2% |
| Immigrants | Northern Europe | 7.0 /100 | #218 | Tragic 3.2% |
| New Zealanders | 6.8 /100 | #219 | Tragic 3.2% |
| Malaysians | 6.6 /100 | #220 | Tragic 3.2% |
| Immigrants | Laos | 6.6 /100 | #221 | Tragic 3.2% |
| Immigrants | Oceania | 6.5 /100 | #222 | Tragic 3.2% |
| Mexicans | 5.6 /100 | #223 | Tragic 3.2% |