Burmese vs Immigrants from Brazil Vision Disability
COMPARE
Burmese
Immigrants from Brazil
Vision Disability
Vision Disability Comparison
Burmese
Immigrants from Brazil
1.8%
VISION DISABILITY
100.0/ 100
METRIC RATING
17th/ 347
METRIC RANK
2.2%
VISION DISABILITY
13.1/ 100
METRIC RATING
209th/ 347
METRIC RANK
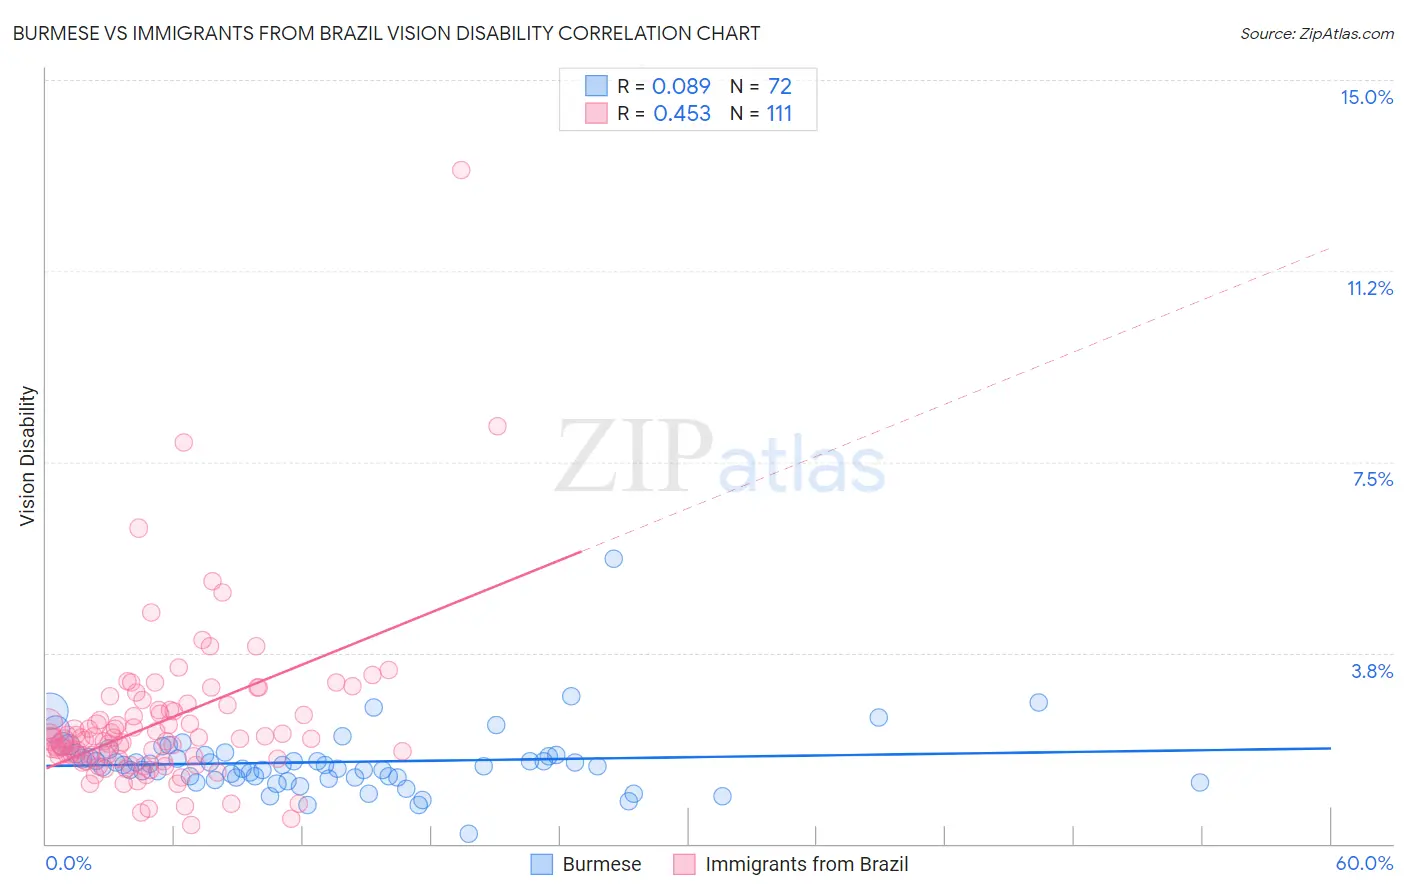
Burmese vs Immigrants from Brazil Vision Disability Correlation Chart
The statistical analysis conducted on geographies consisting of 464,767,032 people shows a slight positive correlation between the proportion of Burmese and percentage of population with vision disability in the United States with a correlation coefficient (R) of 0.089 and weighted average of 1.8%. Similarly, the statistical analysis conducted on geographies consisting of 342,850,216 people shows a moderate positive correlation between the proportion of Immigrants from Brazil and percentage of population with vision disability in the United States with a correlation coefficient (R) of 0.453 and weighted average of 2.2%, a difference of 20.6%.
Vision Disability Correlation Summary
| Measurement | Burmese | Immigrants from Brazil |
| Minimum | 0.21% | 0.36% |
| Maximum | 5.6% | 13.2% |
| Range | 5.4% | 12.9% |
| Mean | 1.6% | 2.4% |
| Median | 1.5% | 2.1% |
| Interquartile 25% (IQ1) | 1.3% | 1.7% |
| Interquartile 75% (IQ3) | 1.7% | 2.6% |
| Interquartile Range (IQR) | 0.43% | 0.94% |
| Standard Deviation (Sample) | 0.68% | 1.6% |
| Standard Deviation (Population) | 0.67% | 1.6% |
Similar Demographics by Vision Disability
Demographics Similar to Burmese by Vision Disability
In terms of vision disability, the demographic groups most similar to Burmese are Indian (Asian) (1.8%, a difference of 0.010%), Bolivian (1.9%, a difference of 0.42%), Immigrants from Bolivia (1.8%, a difference of 0.45%), Immigrants from China (1.8%, a difference of 0.87%), and Immigrants from Eastern Asia (1.8%, a difference of 1.0%).
| Demographics | Rating | Rank | Vision Disability |
| Immigrants | Hong Kong | 100.0 /100 | #10 | Exceptional 1.8% |
| Immigrants | Israel | 100.0 /100 | #11 | Exceptional 1.8% |
| Immigrants | Korea | 100.0 /100 | #12 | Exceptional 1.8% |
| Immigrants | Eastern Asia | 100.0 /100 | #13 | Exceptional 1.8% |
| Immigrants | China | 100.0 /100 | #14 | Exceptional 1.8% |
| Immigrants | Bolivia | 100.0 /100 | #15 | Exceptional 1.8% |
| Indians (Asian) | 100.0 /100 | #16 | Exceptional 1.8% |
| Burmese | 100.0 /100 | #17 | Exceptional 1.8% |
| Bolivians | 100.0 /100 | #18 | Exceptional 1.9% |
| Immigrants | Sri Lanka | 100.0 /100 | #19 | Exceptional 1.9% |
| Asians | 100.0 /100 | #20 | Exceptional 1.9% |
| Turks | 100.0 /100 | #21 | Exceptional 1.9% |
| Immigrants | Pakistan | 100.0 /100 | #22 | Exceptional 1.9% |
| Immigrants | Asia | 99.9 /100 | #23 | Exceptional 1.9% |
| Immigrants | Lithuania | 99.9 /100 | #24 | Exceptional 1.9% |
Demographics Similar to Immigrants from Brazil by Vision Disability
In terms of vision disability, the demographic groups most similar to Immigrants from Brazil are Immigrants from Nigeria (2.2%, a difference of 0.040%), German (2.2%, a difference of 0.040%), Pennsylvania German (2.2%, a difference of 0.18%), Immigrants from Uruguay (2.2%, a difference of 0.23%), and Samoan (2.2%, a difference of 0.31%).
| Demographics | Rating | Rank | Vision Disability |
| Immigrants | Zaire | 18.0 /100 | #202 | Poor 2.2% |
| Dutch | 17.1 /100 | #203 | Poor 2.2% |
| Immigrants | Guyana | 15.9 /100 | #204 | Poor 2.2% |
| Samoans | 15.7 /100 | #205 | Poor 2.2% |
| Pennsylvania Germans | 14.5 /100 | #206 | Poor 2.2% |
| Immigrants | Nigeria | 13.5 /100 | #207 | Poor 2.2% |
| Germans | 13.4 /100 | #208 | Poor 2.2% |
| Immigrants | Brazil | 13.1 /100 | #209 | Poor 2.2% |
| Immigrants | Uruguay | 11.5 /100 | #210 | Poor 2.2% |
| Indonesians | 9.5 /100 | #211 | Tragic 2.2% |
| Bermudans | 9.0 /100 | #212 | Tragic 2.2% |
| Immigrants | Ghana | 8.9 /100 | #213 | Tragic 2.2% |
| Trinidadians and Tobagonians | 8.2 /100 | #214 | Tragic 2.2% |
| Nigerians | 7.2 /100 | #215 | Tragic 2.3% |
| Immigrants | Trinidad and Tobago | 6.1 /100 | #216 | Tragic 2.3% |