Burmese vs Immigrants from Honduras Vision Disability
COMPARE
Burmese
Immigrants from Honduras
Vision Disability
Vision Disability Comparison
Burmese
Immigrants from Honduras
1.8%
VISION DISABILITY
100.0/ 100
METRIC RATING
17th/ 347
METRIC RANK
2.5%
VISION DISABILITY
0.0/ 100
METRIC RATING
291st/ 347
METRIC RANK
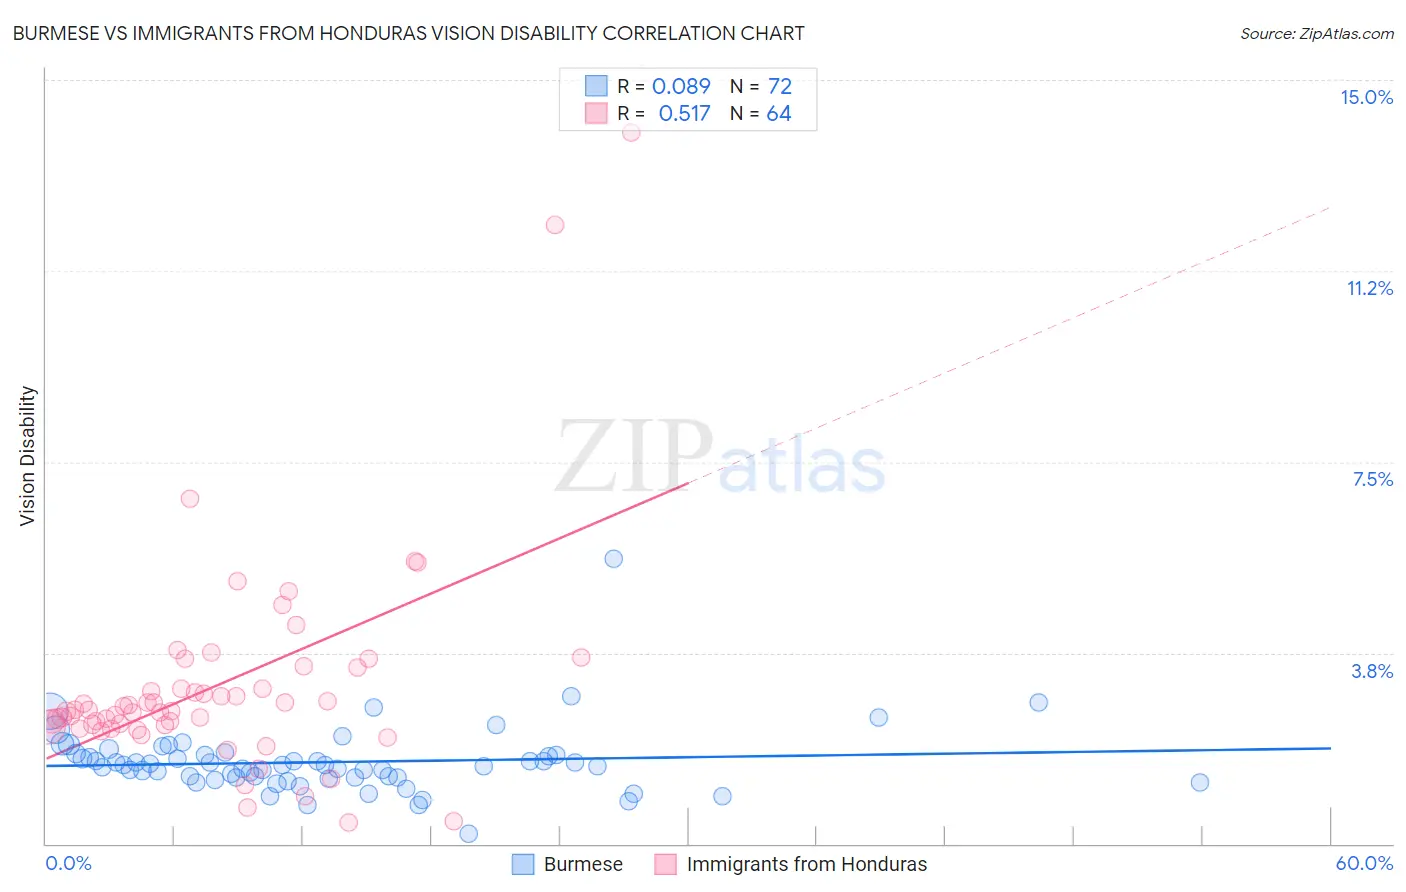
Burmese vs Immigrants from Honduras Vision Disability Correlation Chart
The statistical analysis conducted on geographies consisting of 464,767,032 people shows a slight positive correlation between the proportion of Burmese and percentage of population with vision disability in the United States with a correlation coefficient (R) of 0.089 and weighted average of 1.8%. Similarly, the statistical analysis conducted on geographies consisting of 322,475,782 people shows a substantial positive correlation between the proportion of Immigrants from Honduras and percentage of population with vision disability in the United States with a correlation coefficient (R) of 0.517 and weighted average of 2.5%, a difference of 34.8%.
Vision Disability Correlation Summary
| Measurement | Burmese | Immigrants from Honduras |
| Minimum | 0.21% | 0.42% |
| Maximum | 5.6% | 14.0% |
| Range | 5.4% | 13.5% |
| Mean | 1.6% | 3.1% |
| Median | 1.5% | 2.6% |
| Interquartile 25% (IQ1) | 1.3% | 2.3% |
| Interquartile 75% (IQ3) | 1.7% | 3.3% |
| Interquartile Range (IQR) | 0.43% | 0.94% |
| Standard Deviation (Sample) | 0.68% | 2.1% |
| Standard Deviation (Population) | 0.67% | 2.1% |
Similar Demographics by Vision Disability
Demographics Similar to Burmese by Vision Disability
In terms of vision disability, the demographic groups most similar to Burmese are Indian (Asian) (1.8%, a difference of 0.010%), Bolivian (1.9%, a difference of 0.42%), Immigrants from Bolivia (1.8%, a difference of 0.45%), Immigrants from China (1.8%, a difference of 0.87%), and Immigrants from Eastern Asia (1.8%, a difference of 1.0%).
| Demographics | Rating | Rank | Vision Disability |
| Immigrants | Hong Kong | 100.0 /100 | #10 | Exceptional 1.8% |
| Immigrants | Israel | 100.0 /100 | #11 | Exceptional 1.8% |
| Immigrants | Korea | 100.0 /100 | #12 | Exceptional 1.8% |
| Immigrants | Eastern Asia | 100.0 /100 | #13 | Exceptional 1.8% |
| Immigrants | China | 100.0 /100 | #14 | Exceptional 1.8% |
| Immigrants | Bolivia | 100.0 /100 | #15 | Exceptional 1.8% |
| Indians (Asian) | 100.0 /100 | #16 | Exceptional 1.8% |
| Burmese | 100.0 /100 | #17 | Exceptional 1.8% |
| Bolivians | 100.0 /100 | #18 | Exceptional 1.9% |
| Immigrants | Sri Lanka | 100.0 /100 | #19 | Exceptional 1.9% |
| Asians | 100.0 /100 | #20 | Exceptional 1.9% |
| Turks | 100.0 /100 | #21 | Exceptional 1.9% |
| Immigrants | Pakistan | 100.0 /100 | #22 | Exceptional 1.9% |
| Immigrants | Asia | 99.9 /100 | #23 | Exceptional 1.9% |
| Immigrants | Lithuania | 99.9 /100 | #24 | Exceptional 1.9% |
Demographics Similar to Immigrants from Honduras by Vision Disability
In terms of vision disability, the demographic groups most similar to Immigrants from Honduras are Crow (2.5%, a difference of 0.10%), Yaqui (2.5%, a difference of 0.12%), Immigrants from Cuba (2.5%, a difference of 0.39%), Ottawa (2.5%, a difference of 0.46%), and Nonimmigrants (2.5%, a difference of 0.53%).
| Demographics | Rating | Rank | Vision Disability |
| Yakama | 0.0 /100 | #284 | Tragic 2.5% |
| Immigrants | Central America | 0.0 /100 | #285 | Tragic 2.5% |
| Sioux | 0.0 /100 | #286 | Tragic 2.5% |
| Hondurans | 0.0 /100 | #287 | Tragic 2.5% |
| French American Indians | 0.0 /100 | #288 | Tragic 2.5% |
| Immigrants | Nonimmigrants | 0.0 /100 | #289 | Tragic 2.5% |
| Immigrants | Cuba | 0.0 /100 | #290 | Tragic 2.5% |
| Immigrants | Honduras | 0.0 /100 | #291 | Tragic 2.5% |
| Crow | 0.0 /100 | #292 | Tragic 2.5% |
| Yaqui | 0.0 /100 | #293 | Tragic 2.5% |
| Ottawa | 0.0 /100 | #294 | Tragic 2.5% |
| Delaware | 0.0 /100 | #295 | Tragic 2.5% |
| Immigrants | Mexico | 0.0 /100 | #296 | Tragic 2.5% |
| Immigrants | Dominica | 0.0 /100 | #297 | Tragic 2.5% |
| Mexicans | 0.0 /100 | #298 | Tragic 2.5% |