Burmese vs Immigrants from Yemen Vision Disability
COMPARE
Burmese
Immigrants from Yemen
Vision Disability
Vision Disability Comparison
Burmese
Immigrants from Yemen
1.8%
VISION DISABILITY
100.0/ 100
METRIC RATING
17th/ 347
METRIC RANK
2.6%
VISION DISABILITY
0.0/ 100
METRIC RATING
309th/ 347
METRIC RANK
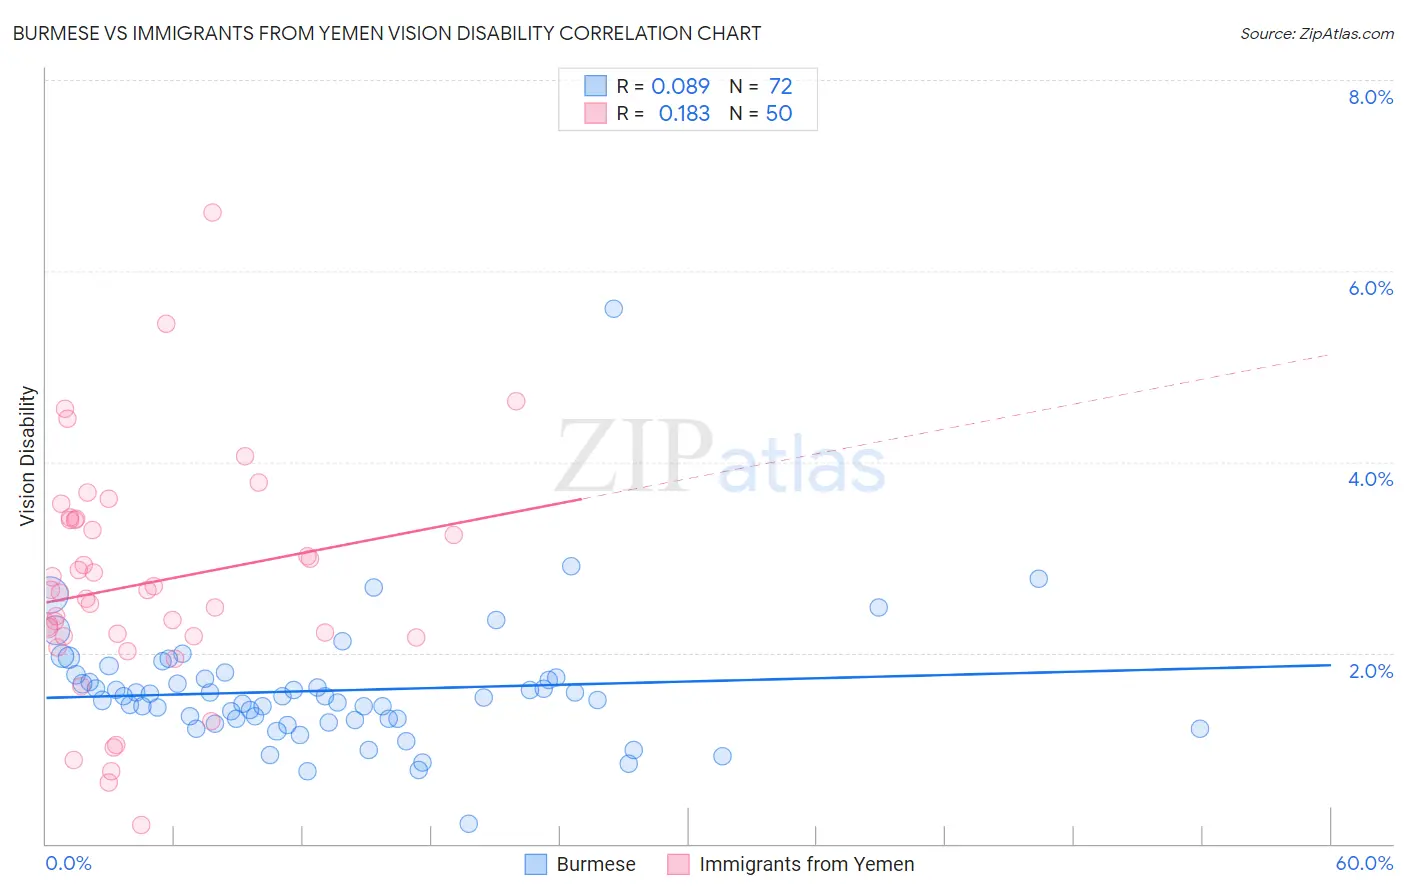
Burmese vs Immigrants from Yemen Vision Disability Correlation Chart
The statistical analysis conducted on geographies consisting of 464,767,032 people shows a slight positive correlation between the proportion of Burmese and percentage of population with vision disability in the United States with a correlation coefficient (R) of 0.089 and weighted average of 1.8%. Similarly, the statistical analysis conducted on geographies consisting of 82,432,015 people shows a poor positive correlation between the proportion of Immigrants from Yemen and percentage of population with vision disability in the United States with a correlation coefficient (R) of 0.183 and weighted average of 2.6%, a difference of 41.5%.
Vision Disability Correlation Summary
| Measurement | Burmese | Immigrants from Yemen |
| Minimum | 0.21% | 0.20% |
| Maximum | 5.6% | 6.6% |
| Range | 5.4% | 6.4% |
| Mean | 1.6% | 2.7% |
| Median | 1.5% | 2.6% |
| Interquartile 25% (IQ1) | 1.3% | 2.2% |
| Interquartile 75% (IQ3) | 1.7% | 3.4% |
| Interquartile Range (IQR) | 0.43% | 1.2% |
| Standard Deviation (Sample) | 0.68% | 1.2% |
| Standard Deviation (Population) | 0.67% | 1.2% |
Similar Demographics by Vision Disability
Demographics Similar to Burmese by Vision Disability
In terms of vision disability, the demographic groups most similar to Burmese are Indian (Asian) (1.8%, a difference of 0.010%), Bolivian (1.9%, a difference of 0.42%), Immigrants from Bolivia (1.8%, a difference of 0.45%), Immigrants from China (1.8%, a difference of 0.87%), and Immigrants from Eastern Asia (1.8%, a difference of 1.0%).
| Demographics | Rating | Rank | Vision Disability |
| Immigrants | Hong Kong | 100.0 /100 | #10 | Exceptional 1.8% |
| Immigrants | Israel | 100.0 /100 | #11 | Exceptional 1.8% |
| Immigrants | Korea | 100.0 /100 | #12 | Exceptional 1.8% |
| Immigrants | Eastern Asia | 100.0 /100 | #13 | Exceptional 1.8% |
| Immigrants | China | 100.0 /100 | #14 | Exceptional 1.8% |
| Immigrants | Bolivia | 100.0 /100 | #15 | Exceptional 1.8% |
| Indians (Asian) | 100.0 /100 | #16 | Exceptional 1.8% |
| Burmese | 100.0 /100 | #17 | Exceptional 1.8% |
| Bolivians | 100.0 /100 | #18 | Exceptional 1.9% |
| Immigrants | Sri Lanka | 100.0 /100 | #19 | Exceptional 1.9% |
| Asians | 100.0 /100 | #20 | Exceptional 1.9% |
| Turks | 100.0 /100 | #21 | Exceptional 1.9% |
| Immigrants | Pakistan | 100.0 /100 | #22 | Exceptional 1.9% |
| Immigrants | Asia | 99.9 /100 | #23 | Exceptional 1.9% |
| Immigrants | Lithuania | 99.9 /100 | #24 | Exceptional 1.9% |
Demographics Similar to Immigrants from Yemen by Vision Disability
In terms of vision disability, the demographic groups most similar to Immigrants from Yemen are Arapaho (2.6%, a difference of 0.29%), Immigrants from Dominican Republic (2.6%, a difference of 0.30%), Blackfeet (2.6%, a difference of 0.32%), Iroquois (2.6%, a difference of 0.33%), and Dominican (2.6%, a difference of 0.37%).
| Demographics | Rating | Rank | Vision Disability |
| Spanish American Indians | 0.0 /100 | #302 | Tragic 2.6% |
| Immigrants | Cabo Verde | 0.0 /100 | #303 | Tragic 2.6% |
| Aleuts | 0.0 /100 | #304 | Tragic 2.6% |
| Hispanics or Latinos | 0.0 /100 | #305 | Tragic 2.6% |
| Iroquois | 0.0 /100 | #306 | Tragic 2.6% |
| Immigrants | Dominican Republic | 0.0 /100 | #307 | Tragic 2.6% |
| Arapaho | 0.0 /100 | #308 | Tragic 2.6% |
| Immigrants | Yemen | 0.0 /100 | #309 | Tragic 2.6% |
| Blackfeet | 0.0 /100 | #310 | Tragic 2.6% |
| Dominicans | 0.0 /100 | #311 | Tragic 2.6% |
| Americans | 0.0 /100 | #312 | Tragic 2.6% |
| Potawatomi | 0.0 /100 | #313 | Tragic 2.6% |
| Inupiat | 0.0 /100 | #314 | Tragic 2.7% |
| Osage | 0.0 /100 | #315 | Tragic 2.7% |
| Shoshone | 0.0 /100 | #316 | Tragic 2.7% |