Bulgarian vs Immigrants from Micronesia Female Disability
COMPARE
Bulgarian
Immigrants from Micronesia
Female Disability
Female Disability Comparison
Bulgarians
Immigrants from Micronesia
11.3%
FEMALE DISABILITY
99.9/ 100
METRIC RATING
55th/ 347
METRIC RANK
13.5%
FEMALE DISABILITY
0.0/ 100
METRIC RATING
304th/ 347
METRIC RANK
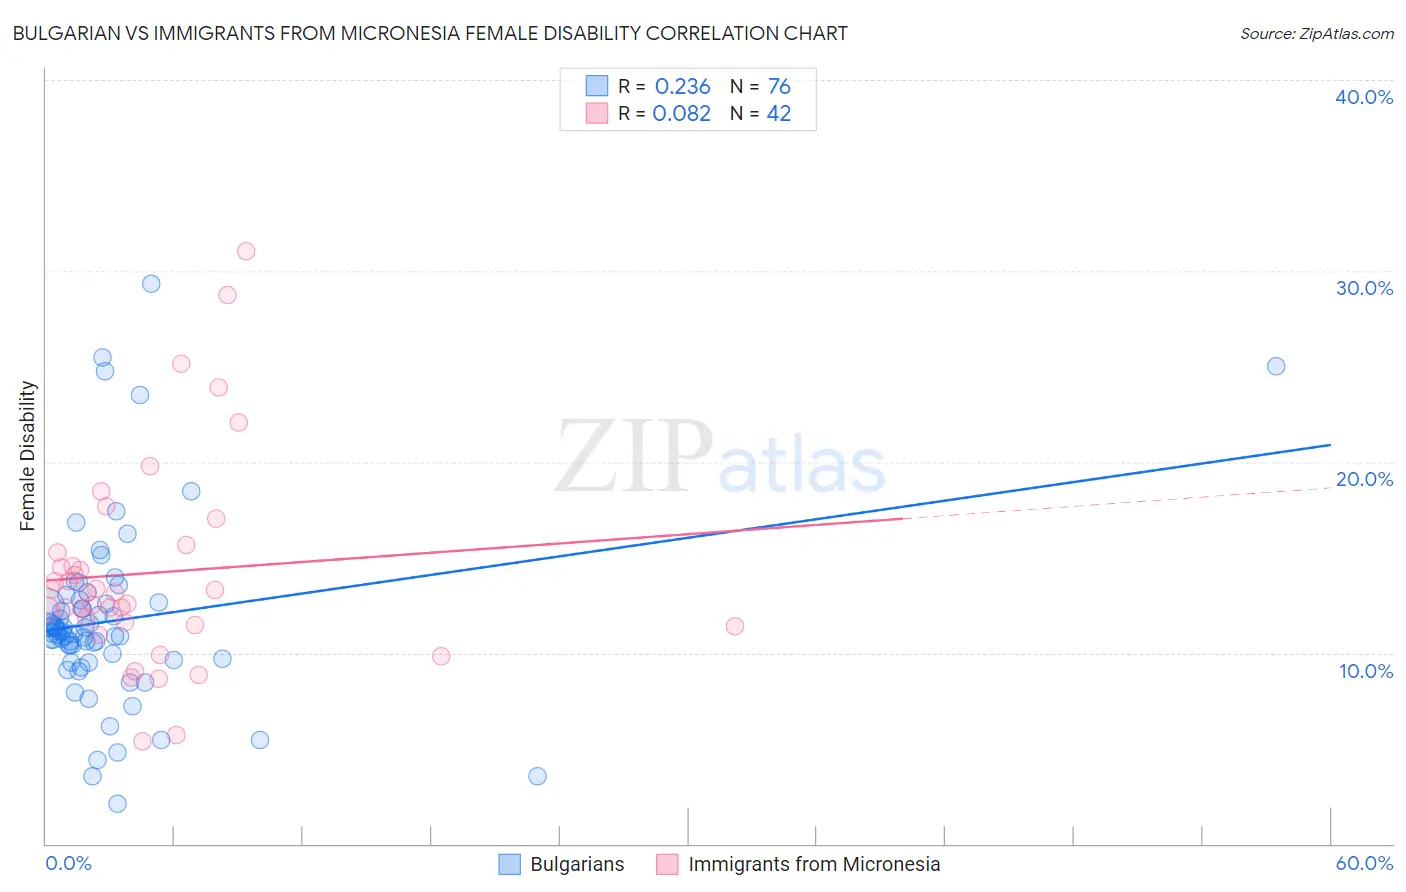
Bulgarian vs Immigrants from Micronesia Female Disability Correlation Chart
The statistical analysis conducted on geographies consisting of 205,628,726 people shows a weak positive correlation between the proportion of Bulgarians and percentage of females with a disability in the United States with a correlation coefficient (R) of 0.236 and weighted average of 11.3%. Similarly, the statistical analysis conducted on geographies consisting of 61,603,210 people shows a slight positive correlation between the proportion of Immigrants from Micronesia and percentage of females with a disability in the United States with a correlation coefficient (R) of 0.082 and weighted average of 13.5%, a difference of 18.7%.
Female Disability Correlation Summary
| Measurement | Bulgarian | Immigrants from Micronesia |
| Minimum | 2.1% | 5.4% |
| Maximum | 29.3% | 31.1% |
| Range | 27.2% | 25.7% |
| Mean | 11.7% | 14.2% |
| Median | 11.1% | 13.2% |
| Interquartile 25% (IQ1) | 9.6% | 11.4% |
| Interquartile 75% (IQ3) | 12.6% | 15.3% |
| Interquartile Range (IQR) | 2.9% | 3.8% |
| Standard Deviation (Sample) | 4.8% | 5.4% |
| Standard Deviation (Population) | 4.8% | 5.4% |
Similar Demographics by Female Disability
Demographics Similar to Bulgarians by Female Disability
In terms of female disability, the demographic groups most similar to Bulgarians are Peruvian (11.3%, a difference of 0.020%), Immigrants from Saudi Arabia (11.3%, a difference of 0.070%), Immigrants from Peru (11.3%, a difference of 0.12%), Taiwanese (11.4%, a difference of 0.23%), and Immigrants from Belgium (11.3%, a difference of 0.24%).
| Demographics | Rating | Rank | Female Disability |
| Zimbabweans | 100.0 /100 | #48 | Exceptional 11.3% |
| Tongans | 100.0 /100 | #49 | Exceptional 11.3% |
| Inupiat | 100.0 /100 | #50 | Exceptional 11.3% |
| Immigrants | Belgium | 100.0 /100 | #51 | Exceptional 11.3% |
| Immigrants | Peru | 99.9 /100 | #52 | Exceptional 11.3% |
| Immigrants | Saudi Arabia | 99.9 /100 | #53 | Exceptional 11.3% |
| Peruvians | 99.9 /100 | #54 | Exceptional 11.3% |
| Bulgarians | 99.9 /100 | #55 | Exceptional 11.3% |
| Taiwanese | 99.9 /100 | #56 | Exceptional 11.4% |
| South Americans | 99.9 /100 | #57 | Exceptional 11.4% |
| Laotians | 99.9 /100 | #58 | Exceptional 11.4% |
| Immigrants | Spain | 99.9 /100 | #59 | Exceptional 11.4% |
| Immigrants | Bulgaria | 99.9 /100 | #60 | Exceptional 11.4% |
| Immigrants | France | 99.9 /100 | #61 | Exceptional 11.4% |
| Sri Lankans | 99.9 /100 | #62 | Exceptional 11.4% |
Demographics Similar to Immigrants from Micronesia by Female Disability
In terms of female disability, the demographic groups most similar to Immigrants from Micronesia are Scotch-Irish (13.4%, a difference of 0.030%), Immigrants from Portugal (13.5%, a difference of 0.030%), African (13.4%, a difference of 0.17%), Dominican (13.5%, a difference of 0.31%), and Pennsylvania German (13.4%, a difference of 0.37%).
| Demographics | Rating | Rank | Female Disability |
| Slovaks | 0.0 /100 | #297 | Tragic 13.3% |
| Immigrants | Nonimmigrants | 0.0 /100 | #298 | Tragic 13.4% |
| Immigrants | Dominican Republic | 0.0 /100 | #299 | Tragic 13.4% |
| Pennsylvania Germans | 0.0 /100 | #300 | Tragic 13.4% |
| Africans | 0.0 /100 | #301 | Tragic 13.4% |
| Scotch-Irish | 0.0 /100 | #302 | Tragic 13.4% |
| Immigrants | Portugal | 0.0 /100 | #303 | Tragic 13.5% |
| Immigrants | Micronesia | 0.0 /100 | #304 | Tragic 13.5% |
| Dominicans | 0.0 /100 | #305 | Tragic 13.5% |
| French Canadians | 0.0 /100 | #306 | Tragic 13.6% |
| Central American Indians | 0.0 /100 | #307 | Tragic 13.6% |
| Cree | 0.0 /100 | #308 | Tragic 13.7% |
| French American Indians | 0.0 /100 | #309 | Tragic 13.7% |
| Apache | 0.0 /100 | #310 | Tragic 13.7% |
| Hopi | 0.0 /100 | #311 | Tragic 13.7% |