Bulgarian vs Immigrants from Kenya Female Disability
COMPARE
Bulgarian
Immigrants from Kenya
Female Disability
Female Disability Comparison
Bulgarians
Immigrants from Kenya
11.3%
FEMALE DISABILITY
99.9/ 100
METRIC RATING
55th/ 347
METRIC RANK
12.0%
FEMALE DISABILITY
83.1/ 100
METRIC RATING
148th/ 347
METRIC RANK
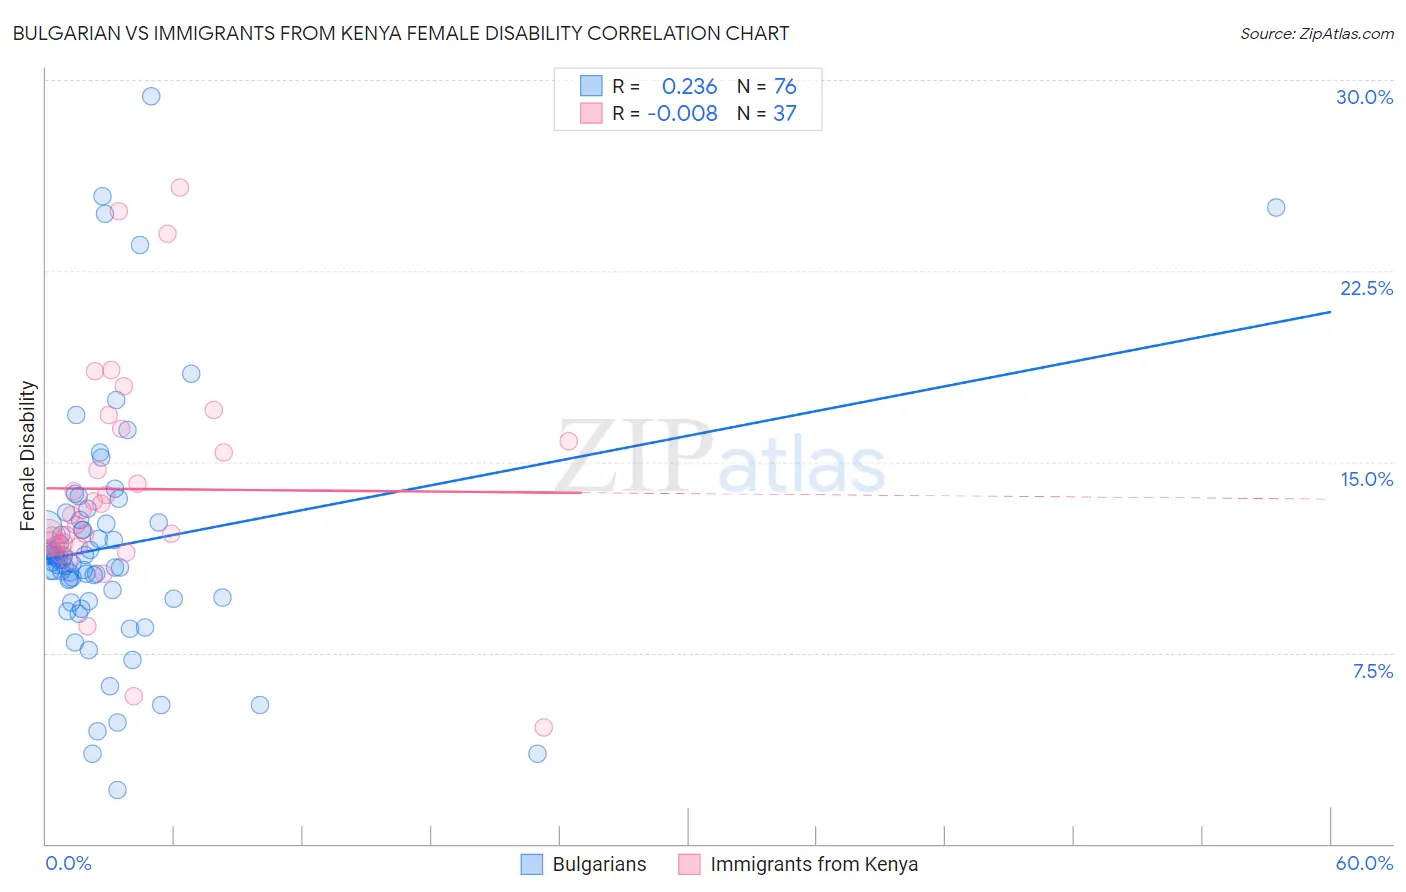
Bulgarian vs Immigrants from Kenya Female Disability Correlation Chart
The statistical analysis conducted on geographies consisting of 205,628,726 people shows a weak positive correlation between the proportion of Bulgarians and percentage of females with a disability in the United States with a correlation coefficient (R) of 0.236 and weighted average of 11.3%. Similarly, the statistical analysis conducted on geographies consisting of 218,056,987 people shows no correlation between the proportion of Immigrants from Kenya and percentage of females with a disability in the United States with a correlation coefficient (R) of -0.008 and weighted average of 12.0%, a difference of 6.0%.
Female Disability Correlation Summary
| Measurement | Bulgarian | Immigrants from Kenya |
| Minimum | 2.1% | 4.5% |
| Maximum | 29.3% | 25.8% |
| Range | 27.2% | 21.2% |
| Mean | 11.7% | 13.9% |
| Median | 11.1% | 12.9% |
| Interquartile 25% (IQ1) | 9.6% | 11.7% |
| Interquartile 75% (IQ3) | 12.6% | 16.1% |
| Interquartile Range (IQR) | 2.9% | 4.3% |
| Standard Deviation (Sample) | 4.8% | 4.4% |
| Standard Deviation (Population) | 4.8% | 4.4% |
Similar Demographics by Female Disability
Demographics Similar to Bulgarians by Female Disability
In terms of female disability, the demographic groups most similar to Bulgarians are Peruvian (11.3%, a difference of 0.020%), Immigrants from Saudi Arabia (11.3%, a difference of 0.070%), Immigrants from Peru (11.3%, a difference of 0.12%), Taiwanese (11.4%, a difference of 0.23%), and Immigrants from Belgium (11.3%, a difference of 0.24%).
| Demographics | Rating | Rank | Female Disability |
| Zimbabweans | 100.0 /100 | #48 | Exceptional 11.3% |
| Tongans | 100.0 /100 | #49 | Exceptional 11.3% |
| Inupiat | 100.0 /100 | #50 | Exceptional 11.3% |
| Immigrants | Belgium | 100.0 /100 | #51 | Exceptional 11.3% |
| Immigrants | Peru | 99.9 /100 | #52 | Exceptional 11.3% |
| Immigrants | Saudi Arabia | 99.9 /100 | #53 | Exceptional 11.3% |
| Peruvians | 99.9 /100 | #54 | Exceptional 11.3% |
| Bulgarians | 99.9 /100 | #55 | Exceptional 11.3% |
| Taiwanese | 99.9 /100 | #56 | Exceptional 11.4% |
| South Americans | 99.9 /100 | #57 | Exceptional 11.4% |
| Laotians | 99.9 /100 | #58 | Exceptional 11.4% |
| Immigrants | Spain | 99.9 /100 | #59 | Exceptional 11.4% |
| Immigrants | Bulgaria | 99.9 /100 | #60 | Exceptional 11.4% |
| Immigrants | France | 99.9 /100 | #61 | Exceptional 11.4% |
| Sri Lankans | 99.9 /100 | #62 | Exceptional 11.4% |
Demographics Similar to Immigrants from Kenya by Female Disability
In terms of female disability, the demographic groups most similar to Immigrants from Kenya are Nigerian (12.0%, a difference of 0.070%), Greek (12.0%, a difference of 0.070%), Pakistani (12.0%, a difference of 0.11%), Immigrants from Moldova (12.0%, a difference of 0.11%), and Icelander (12.0%, a difference of 0.15%).
| Demographics | Rating | Rank | Female Disability |
| Immigrants | Ecuador | 91.5 /100 | #141 | Exceptional 11.9% |
| Immigrants | Africa | 90.0 /100 | #142 | Excellent 11.9% |
| Immigrants | Sudan | 89.6 /100 | #143 | Excellent 11.9% |
| Immigrants | Austria | 87.9 /100 | #144 | Excellent 12.0% |
| Estonians | 87.8 /100 | #145 | Excellent 12.0% |
| Pakistanis | 84.6 /100 | #146 | Excellent 12.0% |
| Nigerians | 84.0 /100 | #147 | Excellent 12.0% |
| Immigrants | Kenya | 83.1 /100 | #148 | Excellent 12.0% |
| Greeks | 82.0 /100 | #149 | Excellent 12.0% |
| Immigrants | Moldova | 81.4 /100 | #150 | Excellent 12.0% |
| Icelanders | 80.7 /100 | #151 | Excellent 12.0% |
| Immigrants | Scotland | 79.3 /100 | #152 | Good 12.0% |
| Sudanese | 79.1 /100 | #153 | Good 12.0% |
| Syrians | 76.9 /100 | #154 | Good 12.1% |
| Ghanaians | 76.6 /100 | #155 | Good 12.1% |