Czechoslovakian vs Immigrants from Micronesia Female Disability
COMPARE
Czechoslovakian
Immigrants from Micronesia
Female Disability
Female Disability Comparison
Czechoslovakians
Immigrants from Micronesia
12.7%
FEMALE DISABILITY
0.9/ 100
METRIC RATING
262nd/ 347
METRIC RANK
13.5%
FEMALE DISABILITY
0.0/ 100
METRIC RATING
304th/ 347
METRIC RANK
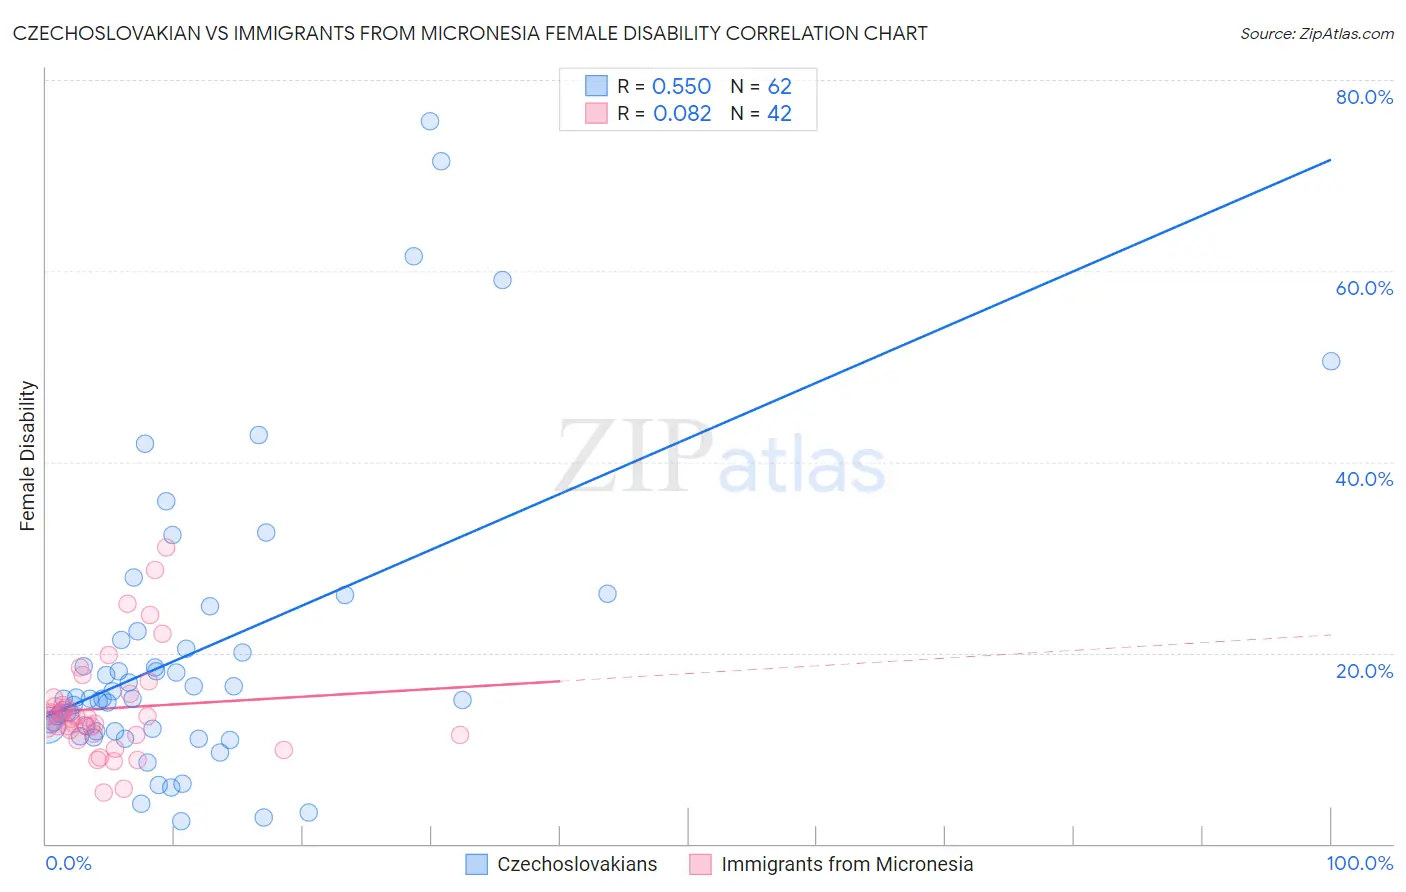
Czechoslovakian vs Immigrants from Micronesia Female Disability Correlation Chart
The statistical analysis conducted on geographies consisting of 368,648,423 people shows a substantial positive correlation between the proportion of Czechoslovakians and percentage of females with a disability in the United States with a correlation coefficient (R) of 0.550 and weighted average of 12.7%. Similarly, the statistical analysis conducted on geographies consisting of 61,603,210 people shows a slight positive correlation between the proportion of Immigrants from Micronesia and percentage of females with a disability in the United States with a correlation coefficient (R) of 0.082 and weighted average of 13.5%, a difference of 5.6%.
Female Disability Correlation Summary
| Measurement | Czechoslovakian | Immigrants from Micronesia |
| Minimum | 2.3% | 5.4% |
| Maximum | 75.7% | 31.1% |
| Range | 73.3% | 25.7% |
| Mean | 20.1% | 14.2% |
| Median | 15.2% | 13.2% |
| Interquartile 25% (IQ1) | 11.8% | 11.4% |
| Interquartile 75% (IQ3) | 21.4% | 15.3% |
| Interquartile Range (IQR) | 9.5% | 3.8% |
| Standard Deviation (Sample) | 15.6% | 5.4% |
| Standard Deviation (Population) | 15.5% | 5.4% |
Similar Demographics by Female Disability
Demographics Similar to Czechoslovakians by Female Disability
In terms of female disability, the demographic groups most similar to Czechoslovakians are Bermudan (12.7%, a difference of 0.070%), Subsaharan African (12.7%, a difference of 0.11%), Immigrants from Armenia (12.7%, a difference of 0.12%), Liberian (12.7%, a difference of 0.20%), and Aleut (12.7%, a difference of 0.20%).
| Demographics | Rating | Rank | Female Disability |
| Immigrants | Germany | 1.3 /100 | #255 | Tragic 12.7% |
| British West Indians | 1.2 /100 | #256 | Tragic 12.7% |
| Liberians | 1.1 /100 | #257 | Tragic 12.7% |
| Aleuts | 1.1 /100 | #258 | Tragic 12.7% |
| Immigrants | Armenia | 1.0 /100 | #259 | Tragic 12.7% |
| Sub-Saharan Africans | 1.0 /100 | #260 | Tragic 12.7% |
| Bermudans | 1.0 /100 | #261 | Tragic 12.7% |
| Czechoslovakians | 0.9 /100 | #262 | Tragic 12.7% |
| Spaniards | 0.7 /100 | #263 | Tragic 12.8% |
| Alaska Natives | 0.6 /100 | #264 | Tragic 12.8% |
| West Indians | 0.5 /100 | #265 | Tragic 12.8% |
| Finns | 0.4 /100 | #266 | Tragic 12.8% |
| Senegalese | 0.4 /100 | #267 | Tragic 12.8% |
| Immigrants | Laos | 0.4 /100 | #268 | Tragic 12.8% |
| Indonesians | 0.4 /100 | #269 | Tragic 12.8% |
Demographics Similar to Immigrants from Micronesia by Female Disability
In terms of female disability, the demographic groups most similar to Immigrants from Micronesia are Scotch-Irish (13.4%, a difference of 0.030%), Immigrants from Portugal (13.5%, a difference of 0.030%), African (13.4%, a difference of 0.17%), Dominican (13.5%, a difference of 0.31%), and Pennsylvania German (13.4%, a difference of 0.37%).
| Demographics | Rating | Rank | Female Disability |
| Slovaks | 0.0 /100 | #297 | Tragic 13.3% |
| Immigrants | Nonimmigrants | 0.0 /100 | #298 | Tragic 13.4% |
| Immigrants | Dominican Republic | 0.0 /100 | #299 | Tragic 13.4% |
| Pennsylvania Germans | 0.0 /100 | #300 | Tragic 13.4% |
| Africans | 0.0 /100 | #301 | Tragic 13.4% |
| Scotch-Irish | 0.0 /100 | #302 | Tragic 13.4% |
| Immigrants | Portugal | 0.0 /100 | #303 | Tragic 13.5% |
| Immigrants | Micronesia | 0.0 /100 | #304 | Tragic 13.5% |
| Dominicans | 0.0 /100 | #305 | Tragic 13.5% |
| French Canadians | 0.0 /100 | #306 | Tragic 13.6% |
| Central American Indians | 0.0 /100 | #307 | Tragic 13.6% |
| Cree | 0.0 /100 | #308 | Tragic 13.7% |
| French American Indians | 0.0 /100 | #309 | Tragic 13.7% |
| Apache | 0.0 /100 | #310 | Tragic 13.7% |
| Hopi | 0.0 /100 | #311 | Tragic 13.7% |