Creek vs Immigrants from Micronesia Female Disability
COMPARE
Creek
Immigrants from Micronesia
Female Disability
Female Disability Comparison
Creek
Immigrants from Micronesia
15.7%
FEMALE DISABILITY
0.0/ 100
METRIC RATING
342nd/ 347
METRIC RANK
13.5%
FEMALE DISABILITY
0.0/ 100
METRIC RATING
304th/ 347
METRIC RANK
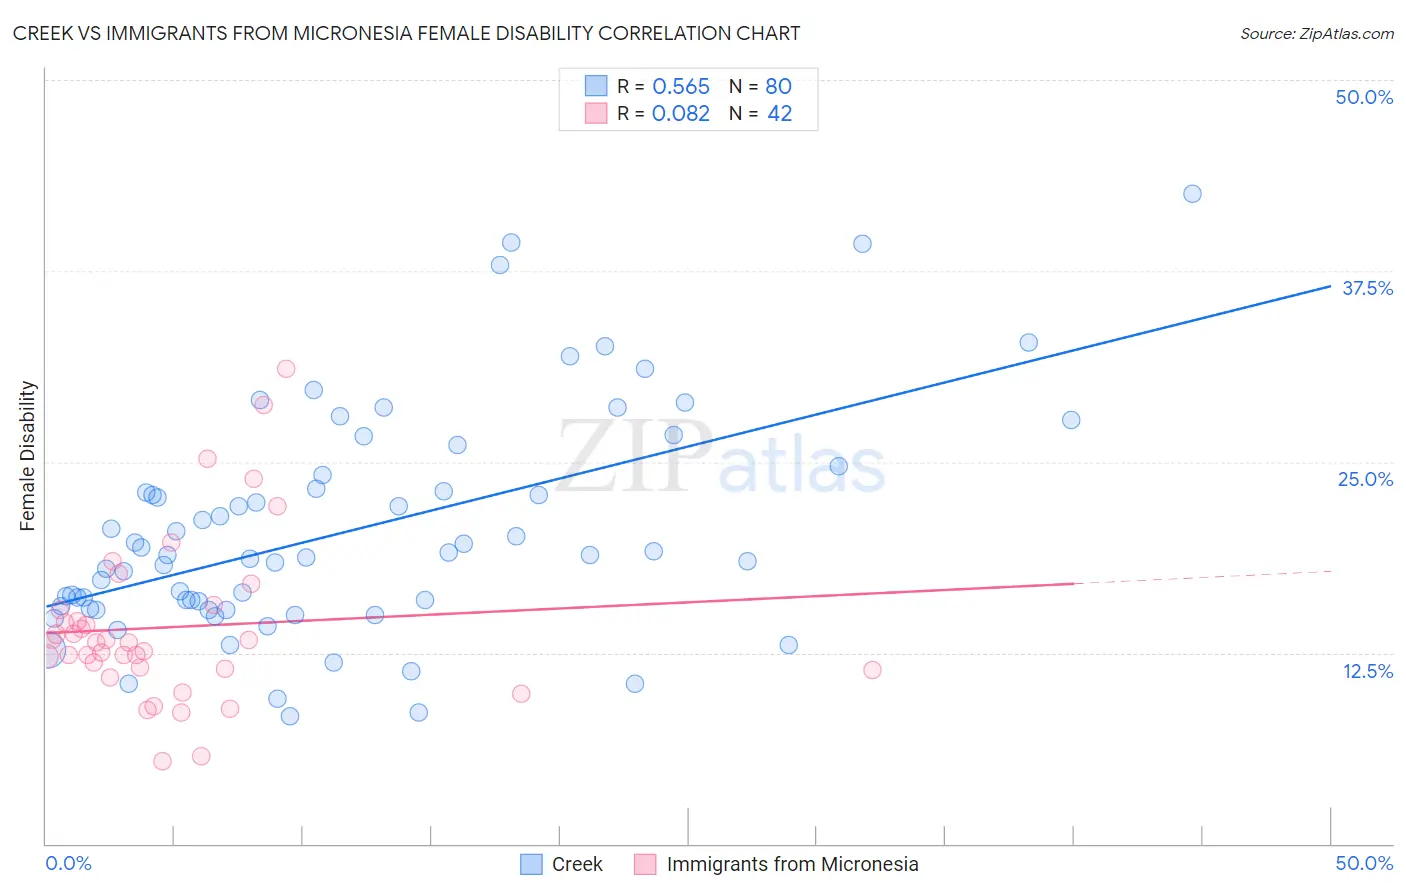
Creek vs Immigrants from Micronesia Female Disability Correlation Chart
The statistical analysis conducted on geographies consisting of 178,448,690 people shows a substantial positive correlation between the proportion of Creek and percentage of females with a disability in the United States with a correlation coefficient (R) of 0.565 and weighted average of 15.7%. Similarly, the statistical analysis conducted on geographies consisting of 61,603,210 people shows a slight positive correlation between the proportion of Immigrants from Micronesia and percentage of females with a disability in the United States with a correlation coefficient (R) of 0.082 and weighted average of 13.5%, a difference of 16.4%.
Female Disability Correlation Summary
| Measurement | Creek | Immigrants from Micronesia |
| Minimum | 8.3% | 5.4% |
| Maximum | 42.6% | 31.1% |
| Range | 34.2% | 25.7% |
| Mean | 20.5% | 14.2% |
| Median | 18.9% | 13.2% |
| Interquartile 25% (IQ1) | 15.4% | 11.4% |
| Interquartile 75% (IQ3) | 23.7% | 15.3% |
| Interquartile Range (IQR) | 8.2% | 3.8% |
| Standard Deviation (Sample) | 7.3% | 5.4% |
| Standard Deviation (Population) | 7.3% | 5.4% |
Similar Demographics by Female Disability
Demographics Similar to Creek by Female Disability
In terms of female disability, the demographic groups most similar to Creek are Lumbee (15.8%, a difference of 0.68%), Kiowa (15.8%, a difference of 0.84%), Choctaw (15.4%, a difference of 1.6%), Chickasaw (15.2%, a difference of 3.0%), and Colville (15.1%, a difference of 4.0%).
| Demographics | Rating | Rank | Female Disability |
| Immigrants | Azores | 0.0 /100 | #333 | Tragic 14.9% |
| Cherokee | 0.0 /100 | #334 | Tragic 14.9% |
| Cajuns | 0.0 /100 | #335 | Tragic 14.9% |
| Seminole | 0.0 /100 | #336 | Tragic 15.0% |
| Tohono O'odham | 0.0 /100 | #337 | Tragic 15.0% |
| Dutch West Indians | 0.0 /100 | #338 | Tragic 15.0% |
| Colville | 0.0 /100 | #339 | Tragic 15.1% |
| Chickasaw | 0.0 /100 | #340 | Tragic 15.2% |
| Choctaw | 0.0 /100 | #341 | Tragic 15.4% |
| Creek | 0.0 /100 | #342 | Tragic 15.7% |
| Lumbee | 0.0 /100 | #343 | Tragic 15.8% |
| Kiowa | 0.0 /100 | #344 | Tragic 15.8% |
| Puerto Ricans | 0.0 /100 | #345 | Tragic 16.6% |
| Tsimshian | 0.0 /100 | #346 | Tragic 16.8% |
| Houma | 0.0 /100 | #347 | Tragic 16.9% |
Demographics Similar to Immigrants from Micronesia by Female Disability
In terms of female disability, the demographic groups most similar to Immigrants from Micronesia are Scotch-Irish (13.4%, a difference of 0.030%), Immigrants from Portugal (13.5%, a difference of 0.030%), African (13.4%, a difference of 0.17%), Dominican (13.5%, a difference of 0.31%), and Pennsylvania German (13.4%, a difference of 0.37%).
| Demographics | Rating | Rank | Female Disability |
| Slovaks | 0.0 /100 | #297 | Tragic 13.3% |
| Immigrants | Nonimmigrants | 0.0 /100 | #298 | Tragic 13.4% |
| Immigrants | Dominican Republic | 0.0 /100 | #299 | Tragic 13.4% |
| Pennsylvania Germans | 0.0 /100 | #300 | Tragic 13.4% |
| Africans | 0.0 /100 | #301 | Tragic 13.4% |
| Scotch-Irish | 0.0 /100 | #302 | Tragic 13.4% |
| Immigrants | Portugal | 0.0 /100 | #303 | Tragic 13.5% |
| Immigrants | Micronesia | 0.0 /100 | #304 | Tragic 13.5% |
| Dominicans | 0.0 /100 | #305 | Tragic 13.5% |
| French Canadians | 0.0 /100 | #306 | Tragic 13.6% |
| Central American Indians | 0.0 /100 | #307 | Tragic 13.6% |
| Cree | 0.0 /100 | #308 | Tragic 13.7% |
| French American Indians | 0.0 /100 | #309 | Tragic 13.7% |
| Apache | 0.0 /100 | #310 | Tragic 13.7% |
| Hopi | 0.0 /100 | #311 | Tragic 13.7% |