Immigrants from Portugal vs Immigrants from Micronesia Female Disability
COMPARE
Immigrants from Portugal
Immigrants from Micronesia
Female Disability
Female Disability Comparison
Immigrants from Portugal
Immigrants from Micronesia
13.5%
FEMALE DISABILITY
0.0/ 100
METRIC RATING
303rd/ 347
METRIC RANK
13.5%
FEMALE DISABILITY
0.0/ 100
METRIC RATING
304th/ 347
METRIC RANK
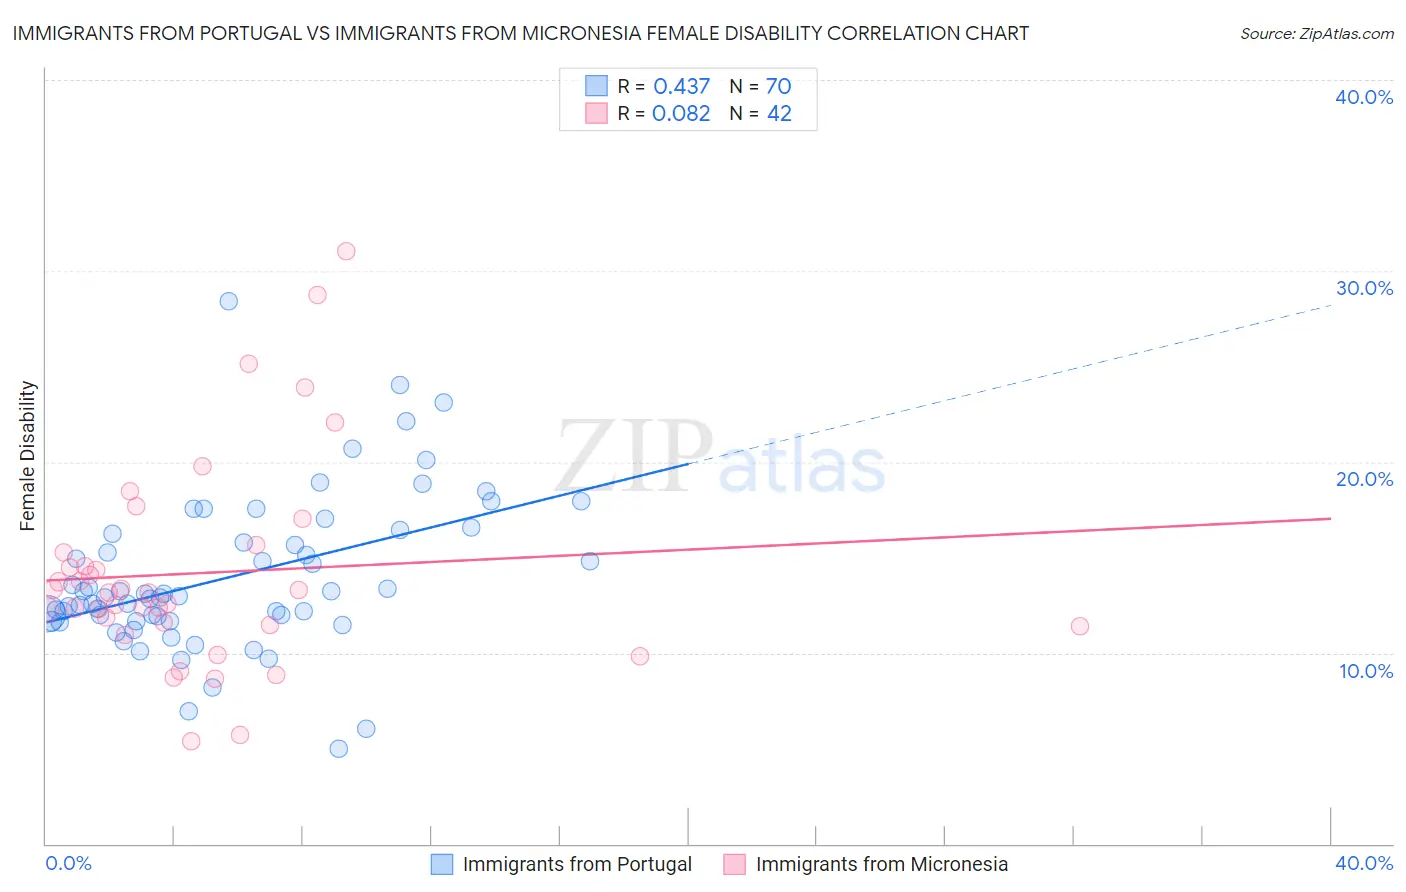
Immigrants from Portugal vs Immigrants from Micronesia Female Disability Correlation Chart
The statistical analysis conducted on geographies consisting of 174,785,293 people shows a moderate positive correlation between the proportion of Immigrants from Portugal and percentage of females with a disability in the United States with a correlation coefficient (R) of 0.437 and weighted average of 13.5%. Similarly, the statistical analysis conducted on geographies consisting of 61,603,210 people shows a slight positive correlation between the proportion of Immigrants from Micronesia and percentage of females with a disability in the United States with a correlation coefficient (R) of 0.082 and weighted average of 13.5%, a difference of 0.030%.
Female Disability Correlation Summary
| Measurement | Immigrants from Portugal | Immigrants from Micronesia |
| Minimum | 5.0% | 5.4% |
| Maximum | 28.4% | 31.1% |
| Range | 23.4% | 25.7% |
| Mean | 14.0% | 14.2% |
| Median | 12.9% | 13.2% |
| Interquartile 25% (IQ1) | 11.7% | 11.4% |
| Interquartile 75% (IQ3) | 16.3% | 15.3% |
| Interquartile Range (IQR) | 4.6% | 3.8% |
| Standard Deviation (Sample) | 4.1% | 5.4% |
| Standard Deviation (Population) | 4.0% | 5.4% |
Demographics Similar to Immigrants from Portugal and Immigrants from Micronesia by Female Disability
In terms of female disability, the demographic groups most similar to Immigrants from Portugal are Scotch-Irish (13.4%, a difference of 0.0%), African (13.4%, a difference of 0.14%), Pennsylvania German (13.4%, a difference of 0.34%), Dominican (13.5%, a difference of 0.34%), and Immigrants from Dominican Republic (13.4%, a difference of 0.35%). Similarly, the demographic groups most similar to Immigrants from Micronesia are Scotch-Irish (13.4%, a difference of 0.030%), African (13.4%, a difference of 0.17%), Dominican (13.5%, a difference of 0.31%), Pennsylvania German (13.4%, a difference of 0.37%), and Immigrants from Dominican Republic (13.4%, a difference of 0.38%).
| Demographics | Rating | Rank | Female Disability |
| Marshallese | 0.0 /100 | #293 | Tragic 13.3% |
| Celtics | 0.0 /100 | #294 | Tragic 13.3% |
| French | 0.0 /100 | #295 | Tragic 13.3% |
| Nepalese | 0.0 /100 | #296 | Tragic 13.3% |
| Slovaks | 0.0 /100 | #297 | Tragic 13.3% |
| Immigrants | Nonimmigrants | 0.0 /100 | #298 | Tragic 13.4% |
| Immigrants | Dominican Republic | 0.0 /100 | #299 | Tragic 13.4% |
| Pennsylvania Germans | 0.0 /100 | #300 | Tragic 13.4% |
| Africans | 0.0 /100 | #301 | Tragic 13.4% |
| Scotch-Irish | 0.0 /100 | #302 | Tragic 13.4% |
| Immigrants | Portugal | 0.0 /100 | #303 | Tragic 13.5% |
| Immigrants | Micronesia | 0.0 /100 | #304 | Tragic 13.5% |
| Dominicans | 0.0 /100 | #305 | Tragic 13.5% |
| French Canadians | 0.0 /100 | #306 | Tragic 13.6% |
| Central American Indians | 0.0 /100 | #307 | Tragic 13.6% |
| Cree | 0.0 /100 | #308 | Tragic 13.7% |
| French American Indians | 0.0 /100 | #309 | Tragic 13.7% |
| Apache | 0.0 /100 | #310 | Tragic 13.7% |
| Hopi | 0.0 /100 | #311 | Tragic 13.7% |
| Delaware | 0.0 /100 | #312 | Tragic 13.8% |
| Blackfeet | 0.0 /100 | #313 | Tragic 13.8% |