Australian vs Immigrants from Micronesia Female Disability
COMPARE
Australian
Immigrants from Micronesia
Female Disability
Female Disability Comparison
Australians
Immigrants from Micronesia
11.7%
FEMALE DISABILITY
98.3/ 100
METRIC RATING
105th/ 347
METRIC RANK
13.5%
FEMALE DISABILITY
0.0/ 100
METRIC RATING
304th/ 347
METRIC RANK
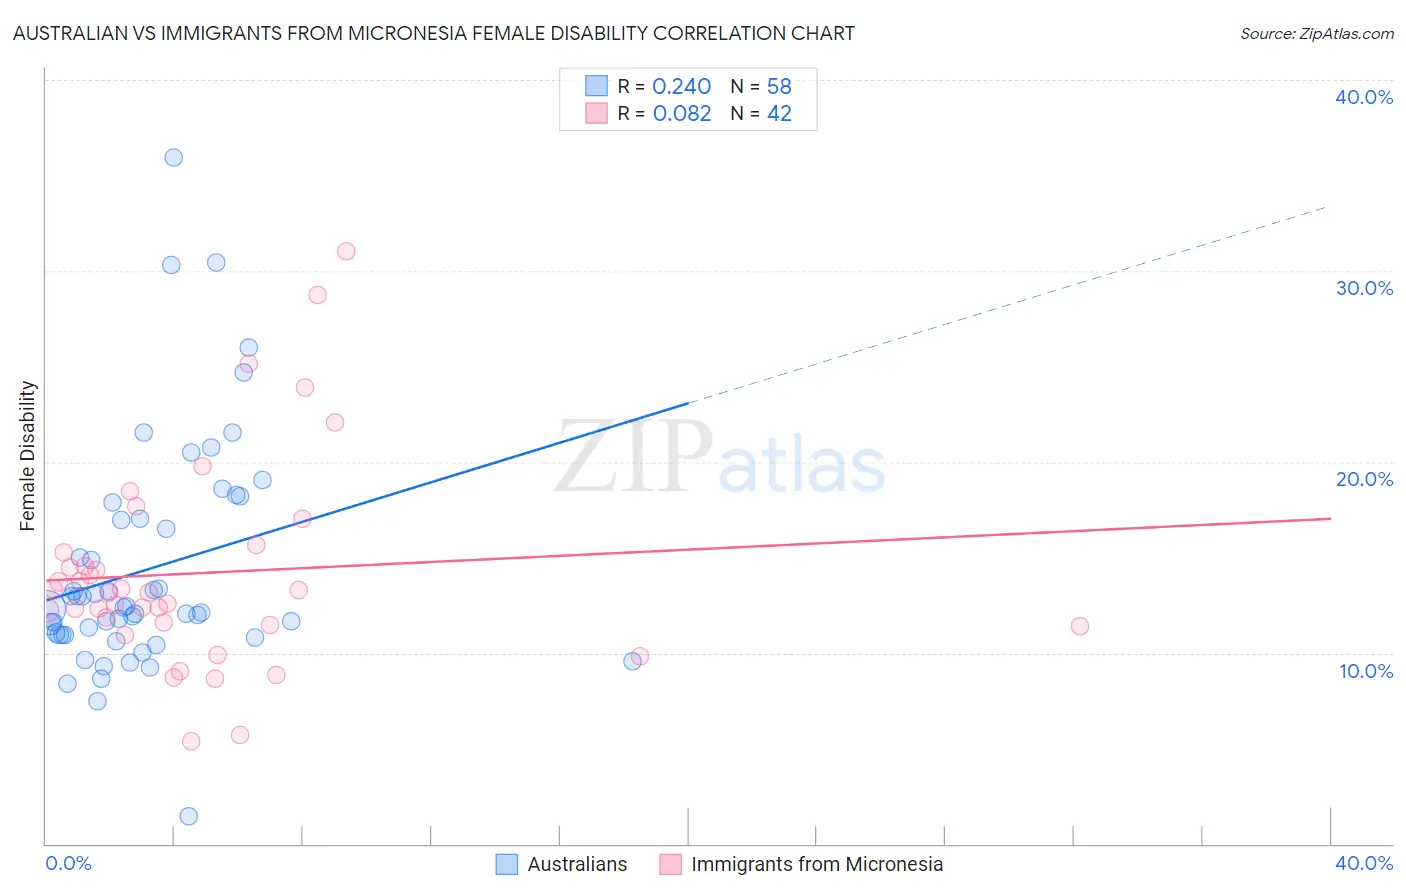
Australian vs Immigrants from Micronesia Female Disability Correlation Chart
The statistical analysis conducted on geographies consisting of 224,135,349 people shows a weak positive correlation between the proportion of Australians and percentage of females with a disability in the United States with a correlation coefficient (R) of 0.240 and weighted average of 11.7%. Similarly, the statistical analysis conducted on geographies consisting of 61,603,210 people shows a slight positive correlation between the proportion of Immigrants from Micronesia and percentage of females with a disability in the United States with a correlation coefficient (R) of 0.082 and weighted average of 13.5%, a difference of 14.7%.
Female Disability Correlation Summary
| Measurement | Australian | Immigrants from Micronesia |
| Minimum | 1.4% | 5.4% |
| Maximum | 36.0% | 31.1% |
| Range | 34.5% | 25.7% |
| Mean | 14.4% | 14.2% |
| Median | 12.3% | 13.2% |
| Interquartile 25% (IQ1) | 11.0% | 11.4% |
| Interquartile 75% (IQ3) | 17.0% | 15.3% |
| Interquartile Range (IQR) | 6.1% | 3.8% |
| Standard Deviation (Sample) | 6.1% | 5.4% |
| Standard Deviation (Population) | 6.0% | 5.4% |
Similar Demographics by Female Disability
Demographics Similar to Australians by Female Disability
In terms of female disability, the demographic groups most similar to Australians are Immigrants from Eastern Africa (11.7%, a difference of 0.020%), Immigrants from Western Asia (11.7%, a difference of 0.020%), Immigrants from Greece (11.7%, a difference of 0.030%), Latvian (11.7%, a difference of 0.050%), and New Zealander (11.7%, a difference of 0.080%).
| Demographics | Rating | Rank | Female Disability |
| Uruguayans | 98.8 /100 | #98 | Exceptional 11.7% |
| Immigrants | Philippines | 98.6 /100 | #99 | Exceptional 11.7% |
| Immigrants | Uruguay | 98.5 /100 | #100 | Exceptional 11.7% |
| Immigrants | Costa Rica | 98.4 /100 | #101 | Exceptional 11.7% |
| Immigrants | South Eastern Asia | 98.4 /100 | #102 | Exceptional 11.7% |
| Immigrants | Eastern Africa | 98.3 /100 | #103 | Exceptional 11.7% |
| Immigrants | Western Asia | 98.3 /100 | #104 | Exceptional 11.7% |
| Australians | 98.3 /100 | #105 | Exceptional 11.7% |
| Immigrants | Greece | 98.2 /100 | #106 | Exceptional 11.7% |
| Latvians | 98.2 /100 | #107 | Exceptional 11.7% |
| New Zealanders | 98.1 /100 | #108 | Exceptional 11.7% |
| Immigrants | Immigrants | 98.1 /100 | #109 | Exceptional 11.7% |
| Soviet Union | 98.1 /100 | #110 | Exceptional 11.7% |
| Costa Ricans | 98.1 /100 | #111 | Exceptional 11.7% |
| Immigrants | Bangladesh | 97.8 /100 | #112 | Exceptional 11.8% |
Demographics Similar to Immigrants from Micronesia by Female Disability
In terms of female disability, the demographic groups most similar to Immigrants from Micronesia are Scotch-Irish (13.4%, a difference of 0.030%), Immigrants from Portugal (13.5%, a difference of 0.030%), African (13.4%, a difference of 0.17%), Dominican (13.5%, a difference of 0.31%), and Pennsylvania German (13.4%, a difference of 0.37%).
| Demographics | Rating | Rank | Female Disability |
| Slovaks | 0.0 /100 | #297 | Tragic 13.3% |
| Immigrants | Nonimmigrants | 0.0 /100 | #298 | Tragic 13.4% |
| Immigrants | Dominican Republic | 0.0 /100 | #299 | Tragic 13.4% |
| Pennsylvania Germans | 0.0 /100 | #300 | Tragic 13.4% |
| Africans | 0.0 /100 | #301 | Tragic 13.4% |
| Scotch-Irish | 0.0 /100 | #302 | Tragic 13.4% |
| Immigrants | Portugal | 0.0 /100 | #303 | Tragic 13.5% |
| Immigrants | Micronesia | 0.0 /100 | #304 | Tragic 13.5% |
| Dominicans | 0.0 /100 | #305 | Tragic 13.5% |
| French Canadians | 0.0 /100 | #306 | Tragic 13.6% |
| Central American Indians | 0.0 /100 | #307 | Tragic 13.6% |
| Cree | 0.0 /100 | #308 | Tragic 13.7% |
| French American Indians | 0.0 /100 | #309 | Tragic 13.7% |
| Apache | 0.0 /100 | #310 | Tragic 13.7% |
| Hopi | 0.0 /100 | #311 | Tragic 13.7% |