Bulgarian vs Immigrants from Micronesia Professional Degree
COMPARE
Bulgarian
Immigrants from Micronesia
Professional Degree
Professional Degree Comparison
Bulgarians
Immigrants from Micronesia
5.7%
PROFESSIONAL DEGREE
100.0/ 100
METRIC RATING
58th/ 347
METRIC RANK
3.2%
PROFESSIONAL DEGREE
0.1/ 100
METRIC RATING
318th/ 347
METRIC RANK
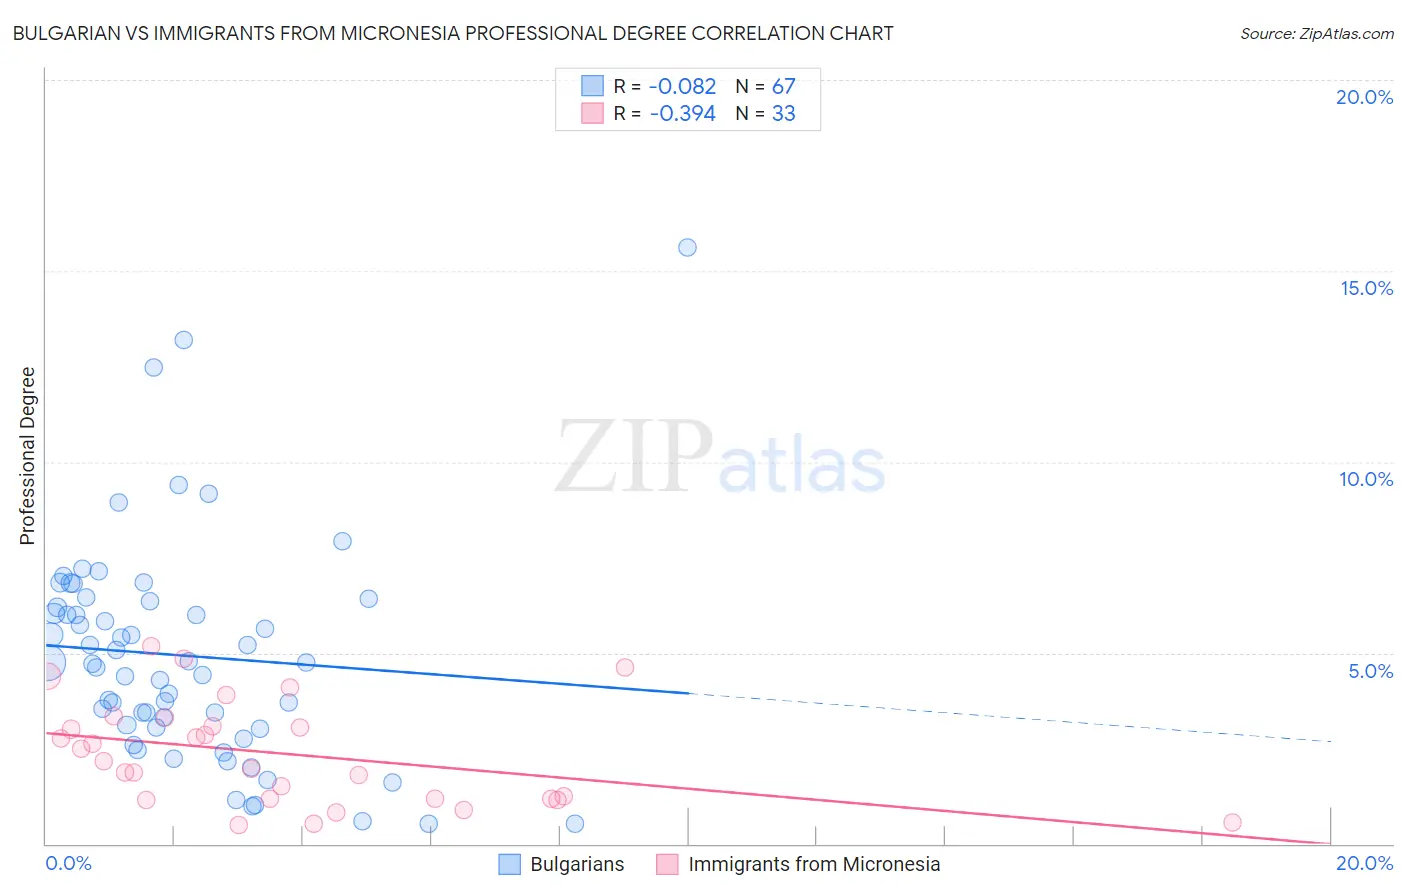
Bulgarian vs Immigrants from Micronesia Professional Degree Correlation Chart
The statistical analysis conducted on geographies consisting of 205,448,400 people shows a slight negative correlation between the proportion of Bulgarians and percentage of population with at least professional degree education in the United States with a correlation coefficient (R) of -0.082 and weighted average of 5.7%. Similarly, the statistical analysis conducted on geographies consisting of 61,532,393 people shows a mild negative correlation between the proportion of Immigrants from Micronesia and percentage of population with at least professional degree education in the United States with a correlation coefficient (R) of -0.394 and weighted average of 3.2%, a difference of 75.0%.
Professional Degree Correlation Summary
| Measurement | Bulgarian | Immigrants from Micronesia |
| Minimum | 0.51% | 0.49% |
| Maximum | 15.6% | 5.2% |
| Range | 15.1% | 4.7% |
| Mean | 4.9% | 2.4% |
| Median | 4.7% | 2.2% |
| Interquartile 25% (IQ1) | 3.1% | 1.2% |
| Interquartile 75% (IQ3) | 6.4% | 3.2% |
| Interquartile Range (IQR) | 3.3% | 2.0% |
| Standard Deviation (Sample) | 2.9% | 1.3% |
| Standard Deviation (Population) | 2.9% | 1.3% |
Similar Demographics by Professional Degree
Demographics Similar to Bulgarians by Professional Degree
In terms of professional degree, the demographic groups most similar to Bulgarians are Immigrants from Europe (5.6%, a difference of 0.52%), South African (5.7%, a difference of 0.59%), Immigrants from Malaysia (5.7%, a difference of 0.86%), Bolivian (5.6%, a difference of 0.94%), and Immigrants from Western Europe (5.7%, a difference of 0.98%).
| Demographics | Rating | Rank | Professional Degree |
| Immigrants | Greece | 100.0 /100 | #51 | Exceptional 5.8% |
| Immigrants | Serbia | 100.0 /100 | #52 | Exceptional 5.8% |
| Immigrants | Netherlands | 100.0 /100 | #53 | Exceptional 5.8% |
| Immigrants | Kuwait | 100.0 /100 | #54 | Exceptional 5.7% |
| Immigrants | Western Europe | 100.0 /100 | #55 | Exceptional 5.7% |
| Immigrants | Malaysia | 100.0 /100 | #56 | Exceptional 5.7% |
| South Africans | 100.0 /100 | #57 | Exceptional 5.7% |
| Bulgarians | 100.0 /100 | #58 | Exceptional 5.7% |
| Immigrants | Europe | 100.0 /100 | #59 | Exceptional 5.6% |
| Bolivians | 99.9 /100 | #60 | Exceptional 5.6% |
| Immigrants | Lithuania | 99.9 /100 | #61 | Exceptional 5.6% |
| Immigrants | Belarus | 99.9 /100 | #62 | Exceptional 5.5% |
| Asians | 99.9 /100 | #63 | Exceptional 5.5% |
| Immigrants | Asia | 99.9 /100 | #64 | Exceptional 5.5% |
| Immigrants | Bolivia | 99.9 /100 | #65 | Exceptional 5.5% |
Demographics Similar to Immigrants from Micronesia by Professional Degree
In terms of professional degree, the demographic groups most similar to Immigrants from Micronesia are Nepalese (3.2%, a difference of 0.030%), Puerto Rican (3.2%, a difference of 0.24%), Choctaw (3.2%, a difference of 0.24%), Immigrants from Laos (3.2%, a difference of 0.25%), and Mexican American Indian (3.3%, a difference of 0.93%).
| Demographics | Rating | Rank | Professional Degree |
| Cherokee | 0.1 /100 | #311 | Tragic 3.3% |
| Sioux | 0.1 /100 | #312 | Tragic 3.3% |
| Yuman | 0.1 /100 | #313 | Tragic 3.3% |
| Mexican American Indians | 0.1 /100 | #314 | Tragic 3.3% |
| Immigrants | Laos | 0.1 /100 | #315 | Tragic 3.2% |
| Puerto Ricans | 0.1 /100 | #316 | Tragic 3.2% |
| Nepalese | 0.1 /100 | #317 | Tragic 3.2% |
| Immigrants | Micronesia | 0.1 /100 | #318 | Tragic 3.2% |
| Choctaw | 0.1 /100 | #319 | Tragic 3.2% |
| Seminole | 0.1 /100 | #320 | Tragic 3.2% |
| Tsimshian | 0.0 /100 | #321 | Tragic 3.2% |
| Hispanics or Latinos | 0.0 /100 | #322 | Tragic 3.2% |
| Inupiat | 0.0 /100 | #323 | Tragic 3.2% |
| Crow | 0.0 /100 | #324 | Tragic 3.2% |
| Yaqui | 0.0 /100 | #325 | Tragic 3.2% |