Bulgarian vs Immigrants from Venezuela Female Disability
COMPARE
Bulgarian
Immigrants from Venezuela
Female Disability
Female Disability Comparison
Bulgarians
Immigrants from Venezuela
11.3%
FEMALE DISABILITY
99.9/ 100
METRIC RATING
55th/ 347
METRIC RANK
10.9%
FEMALE DISABILITY
100.0/ 100
METRIC RATING
19th/ 347
METRIC RANK
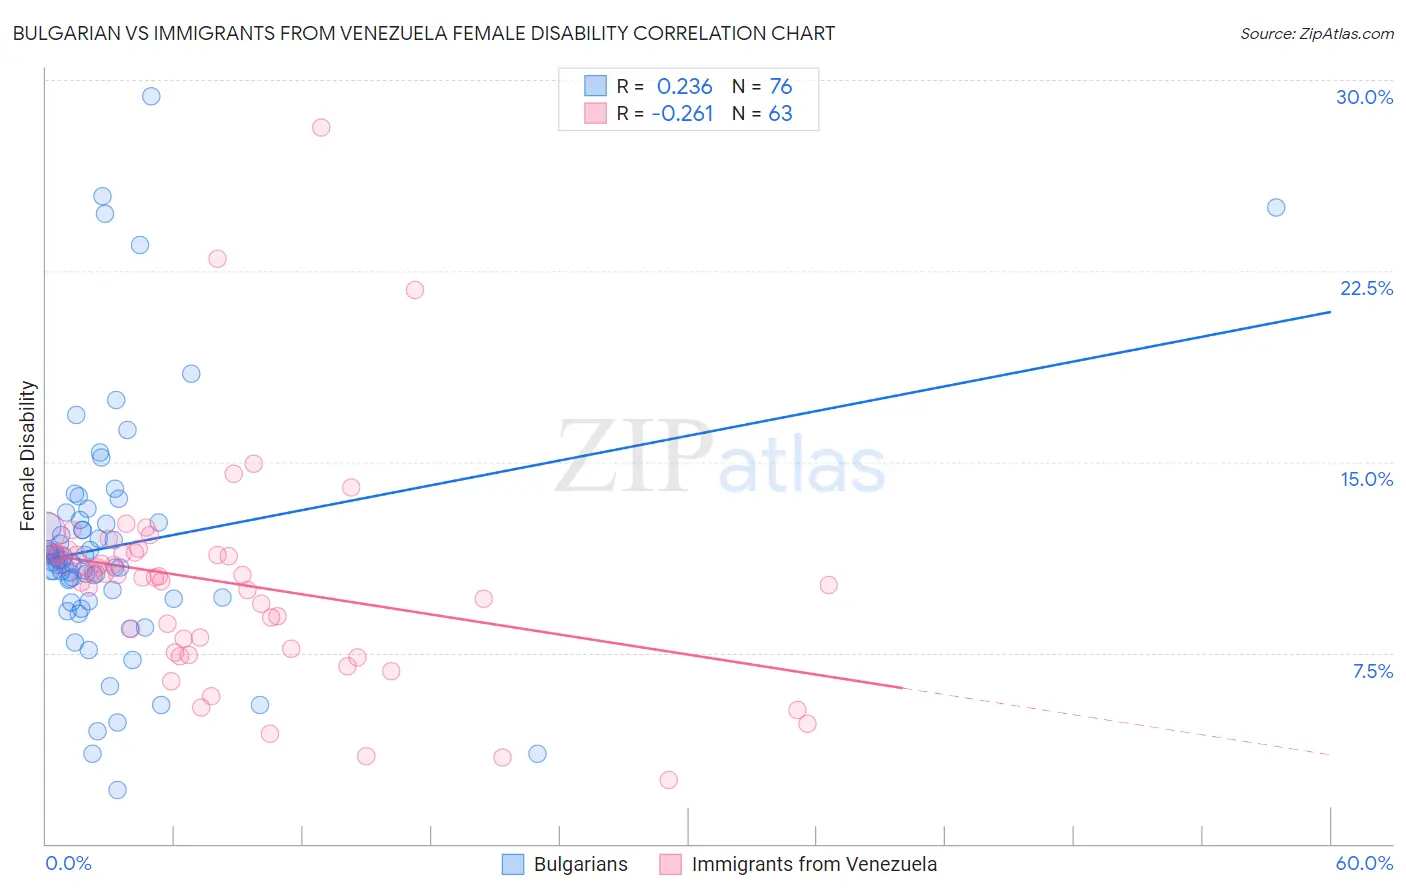
Bulgarian vs Immigrants from Venezuela Female Disability Correlation Chart
The statistical analysis conducted on geographies consisting of 205,628,726 people shows a weak positive correlation between the proportion of Bulgarians and percentage of females with a disability in the United States with a correlation coefficient (R) of 0.236 and weighted average of 11.3%. Similarly, the statistical analysis conducted on geographies consisting of 287,842,421 people shows a weak negative correlation between the proportion of Immigrants from Venezuela and percentage of females with a disability in the United States with a correlation coefficient (R) of -0.261 and weighted average of 10.9%, a difference of 4.4%.
Female Disability Correlation Summary
| Measurement | Bulgarian | Immigrants from Venezuela |
| Minimum | 2.1% | 2.5% |
| Maximum | 29.3% | 28.1% |
| Range | 27.2% | 25.6% |
| Mean | 11.7% | 10.2% |
| Median | 11.1% | 10.5% |
| Interquartile 25% (IQ1) | 9.6% | 7.7% |
| Interquartile 75% (IQ3) | 12.6% | 11.4% |
| Interquartile Range (IQR) | 2.9% | 3.7% |
| Standard Deviation (Sample) | 4.8% | 4.2% |
| Standard Deviation (Population) | 4.8% | 4.2% |
Similar Demographics by Female Disability
Demographics Similar to Bulgarians by Female Disability
In terms of female disability, the demographic groups most similar to Bulgarians are Peruvian (11.3%, a difference of 0.020%), Immigrants from Saudi Arabia (11.3%, a difference of 0.070%), Immigrants from Peru (11.3%, a difference of 0.12%), Taiwanese (11.4%, a difference of 0.23%), and Immigrants from Belgium (11.3%, a difference of 0.24%).
| Demographics | Rating | Rank | Female Disability |
| Zimbabweans | 100.0 /100 | #48 | Exceptional 11.3% |
| Tongans | 100.0 /100 | #49 | Exceptional 11.3% |
| Inupiat | 100.0 /100 | #50 | Exceptional 11.3% |
| Immigrants | Belgium | 100.0 /100 | #51 | Exceptional 11.3% |
| Immigrants | Peru | 99.9 /100 | #52 | Exceptional 11.3% |
| Immigrants | Saudi Arabia | 99.9 /100 | #53 | Exceptional 11.3% |
| Peruvians | 99.9 /100 | #54 | Exceptional 11.3% |
| Bulgarians | 99.9 /100 | #55 | Exceptional 11.3% |
| Taiwanese | 99.9 /100 | #56 | Exceptional 11.4% |
| South Americans | 99.9 /100 | #57 | Exceptional 11.4% |
| Laotians | 99.9 /100 | #58 | Exceptional 11.4% |
| Immigrants | Spain | 99.9 /100 | #59 | Exceptional 11.4% |
| Immigrants | Bulgaria | 99.9 /100 | #60 | Exceptional 11.4% |
| Immigrants | France | 99.9 /100 | #61 | Exceptional 11.4% |
| Sri Lankans | 99.9 /100 | #62 | Exceptional 11.4% |
Demographics Similar to Immigrants from Venezuela by Female Disability
In terms of female disability, the demographic groups most similar to Immigrants from Venezuela are Immigrants from Pakistan (10.9%, a difference of 0.17%), Immigrants from Iran (10.8%, a difference of 0.21%), Asian (10.9%, a difference of 0.54%), Indian (Asian) (10.8%, a difference of 0.60%), and Immigrants from Sri Lanka (10.9%, a difference of 0.66%).
| Demographics | Rating | Rank | Female Disability |
| Immigrants | Israel | 100.0 /100 | #12 | Exceptional 10.7% |
| Immigrants | Eastern Asia | 100.0 /100 | #13 | Exceptional 10.7% |
| Immigrants | China | 100.0 /100 | #14 | Exceptional 10.7% |
| Burmese | 100.0 /100 | #15 | Exceptional 10.7% |
| Okinawans | 100.0 /100 | #16 | Exceptional 10.8% |
| Indians (Asian) | 100.0 /100 | #17 | Exceptional 10.8% |
| Immigrants | Iran | 100.0 /100 | #18 | Exceptional 10.8% |
| Immigrants | Venezuela | 100.0 /100 | #19 | Exceptional 10.9% |
| Immigrants | Pakistan | 100.0 /100 | #20 | Exceptional 10.9% |
| Asians | 100.0 /100 | #21 | Exceptional 10.9% |
| Immigrants | Sri Lanka | 100.0 /100 | #22 | Exceptional 10.9% |
| Venezuelans | 100.0 /100 | #23 | Exceptional 11.0% |
| Immigrants | Argentina | 100.0 /100 | #24 | Exceptional 11.0% |
| Immigrants | Asia | 100.0 /100 | #25 | Exceptional 11.0% |
| Argentineans | 100.0 /100 | #26 | Exceptional 11.0% |