Bulgarian vs Seminole Female Disability
COMPARE
Bulgarian
Seminole
Female Disability
Female Disability Comparison
Bulgarians
Seminole
11.3%
FEMALE DISABILITY
99.9/ 100
METRIC RATING
55th/ 347
METRIC RANK
15.0%
FEMALE DISABILITY
0.0/ 100
METRIC RATING
336th/ 347
METRIC RANK
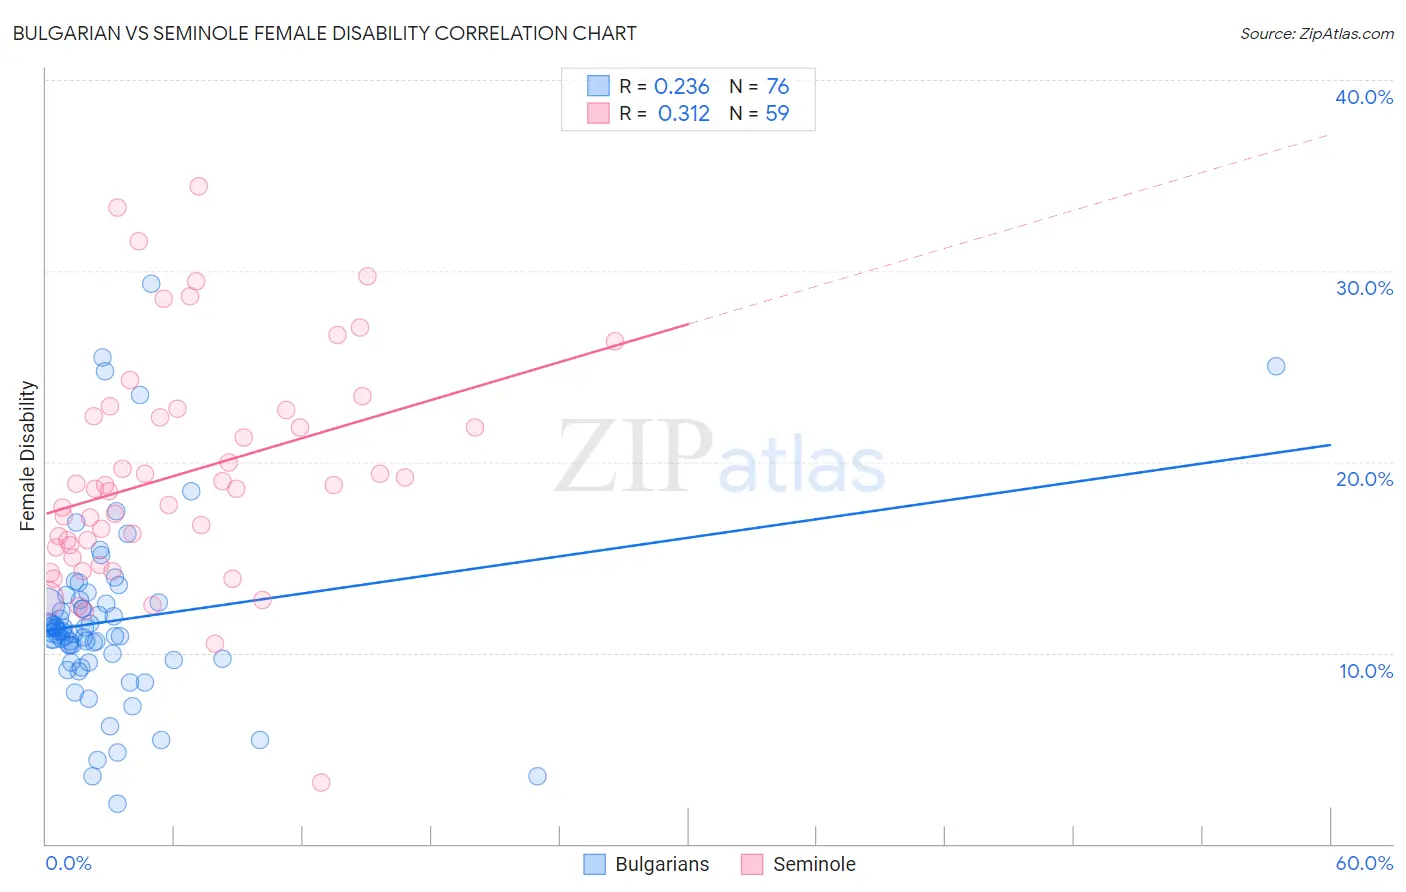
Bulgarian vs Seminole Female Disability Correlation Chart
The statistical analysis conducted on geographies consisting of 205,628,726 people shows a weak positive correlation between the proportion of Bulgarians and percentage of females with a disability in the United States with a correlation coefficient (R) of 0.236 and weighted average of 11.3%. Similarly, the statistical analysis conducted on geographies consisting of 118,309,192 people shows a mild positive correlation between the proportion of Seminole and percentage of females with a disability in the United States with a correlation coefficient (R) of 0.312 and weighted average of 15.0%, a difference of 32.0%.
Female Disability Correlation Summary
| Measurement | Bulgarian | Seminole |
| Minimum | 2.1% | 3.2% |
| Maximum | 29.3% | 34.4% |
| Range | 27.2% | 31.3% |
| Mean | 11.7% | 19.4% |
| Median | 11.1% | 18.6% |
| Interquartile 25% (IQ1) | 9.6% | 15.5% |
| Interquartile 75% (IQ3) | 12.6% | 22.7% |
| Interquartile Range (IQR) | 2.9% | 7.2% |
| Standard Deviation (Sample) | 4.8% | 6.0% |
| Standard Deviation (Population) | 4.8% | 6.0% |
Similar Demographics by Female Disability
Demographics Similar to Bulgarians by Female Disability
In terms of female disability, the demographic groups most similar to Bulgarians are Peruvian (11.3%, a difference of 0.020%), Immigrants from Saudi Arabia (11.3%, a difference of 0.070%), Immigrants from Peru (11.3%, a difference of 0.12%), Taiwanese (11.4%, a difference of 0.23%), and Immigrants from Belgium (11.3%, a difference of 0.24%).
| Demographics | Rating | Rank | Female Disability |
| Zimbabweans | 100.0 /100 | #48 | Exceptional 11.3% |
| Tongans | 100.0 /100 | #49 | Exceptional 11.3% |
| Inupiat | 100.0 /100 | #50 | Exceptional 11.3% |
| Immigrants | Belgium | 100.0 /100 | #51 | Exceptional 11.3% |
| Immigrants | Peru | 99.9 /100 | #52 | Exceptional 11.3% |
| Immigrants | Saudi Arabia | 99.9 /100 | #53 | Exceptional 11.3% |
| Peruvians | 99.9 /100 | #54 | Exceptional 11.3% |
| Bulgarians | 99.9 /100 | #55 | Exceptional 11.3% |
| Taiwanese | 99.9 /100 | #56 | Exceptional 11.4% |
| South Americans | 99.9 /100 | #57 | Exceptional 11.4% |
| Laotians | 99.9 /100 | #58 | Exceptional 11.4% |
| Immigrants | Spain | 99.9 /100 | #59 | Exceptional 11.4% |
| Immigrants | Bulgaria | 99.9 /100 | #60 | Exceptional 11.4% |
| Immigrants | France | 99.9 /100 | #61 | Exceptional 11.4% |
| Sri Lankans | 99.9 /100 | #62 | Exceptional 11.4% |
Demographics Similar to Seminole by Female Disability
In terms of female disability, the demographic groups most similar to Seminole are Tohono O'odham (15.0%, a difference of 0.12%), Dutch West Indian (15.0%, a difference of 0.26%), Cajun (14.9%, a difference of 0.67%), Colville (15.1%, a difference of 0.67%), and Cherokee (14.9%, a difference of 0.69%).
| Demographics | Rating | Rank | Female Disability |
| Osage | 0.0 /100 | #329 | Tragic 14.3% |
| Yuman | 0.0 /100 | #330 | Tragic 14.5% |
| Immigrants | Cabo Verde | 0.0 /100 | #331 | Tragic 14.6% |
| Pima | 0.0 /100 | #332 | Tragic 14.8% |
| Immigrants | Azores | 0.0 /100 | #333 | Tragic 14.9% |
| Cherokee | 0.0 /100 | #334 | Tragic 14.9% |
| Cajuns | 0.0 /100 | #335 | Tragic 14.9% |
| Seminole | 0.0 /100 | #336 | Tragic 15.0% |
| Tohono O'odham | 0.0 /100 | #337 | Tragic 15.0% |
| Dutch West Indians | 0.0 /100 | #338 | Tragic 15.0% |
| Colville | 0.0 /100 | #339 | Tragic 15.1% |
| Chickasaw | 0.0 /100 | #340 | Tragic 15.2% |
| Choctaw | 0.0 /100 | #341 | Tragic 15.4% |
| Creek | 0.0 /100 | #342 | Tragic 15.7% |
| Lumbee | 0.0 /100 | #343 | Tragic 15.8% |