British vs Tlingit-Haida Female Disability
COMPARE
British
Tlingit-Haida
Female Disability
Female Disability Comparison
British
Tlingit-Haida
12.4%
FEMALE DISABILITY
12.7/ 100
METRIC RATING
217th/ 347
METRIC RANK
13.2%
FEMALE DISABILITY
0.0/ 100
METRIC RATING
289th/ 347
METRIC RANK
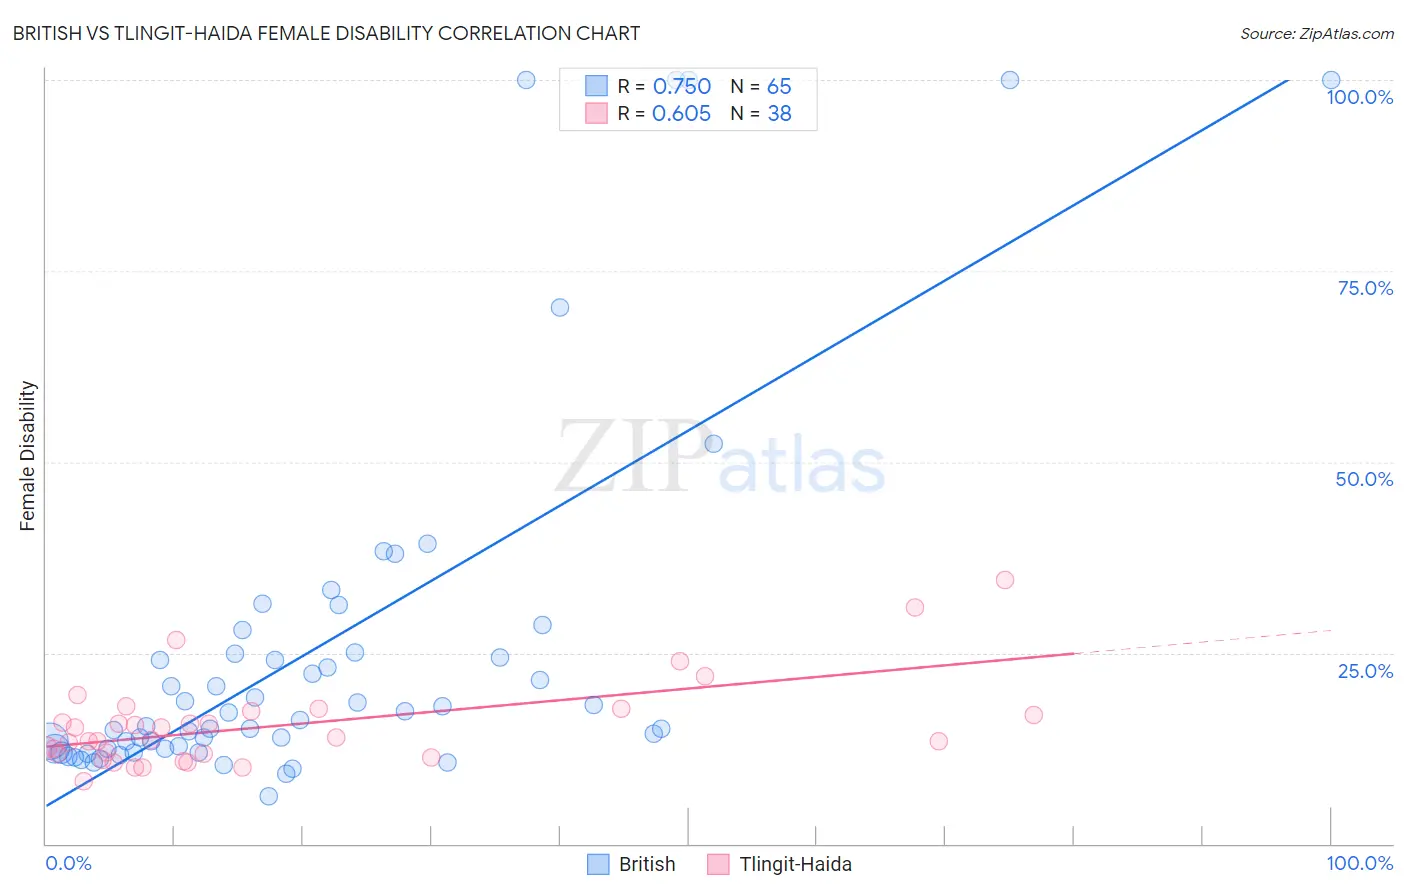
British vs Tlingit-Haida Female Disability Correlation Chart
The statistical analysis conducted on geographies consisting of 531,338,456 people shows a strong positive correlation between the proportion of British and percentage of females with a disability in the United States with a correlation coefficient (R) of 0.750 and weighted average of 12.4%. Similarly, the statistical analysis conducted on geographies consisting of 60,854,290 people shows a significant positive correlation between the proportion of Tlingit-Haida and percentage of females with a disability in the United States with a correlation coefficient (R) of 0.605 and weighted average of 13.2%, a difference of 6.4%.
Female Disability Correlation Summary
| Measurement | British | Tlingit-Haida |
| Minimum | 6.2% | 8.2% |
| Maximum | 100.0% | 34.5% |
| Range | 93.8% | 26.2% |
| Mean | 25.6% | 15.5% |
| Median | 16.2% | 13.7% |
| Interquartile 25% (IQ1) | 12.4% | 11.8% |
| Interquartile 75% (IQ3) | 25.0% | 17.3% |
| Interquartile Range (IQR) | 12.6% | 5.5% |
| Standard Deviation (Sample) | 24.1% | 5.7% |
| Standard Deviation (Population) | 23.9% | 5.6% |
Similar Demographics by Female Disability
Demographics Similar to British by Female Disability
In terms of female disability, the demographic groups most similar to British are Immigrants from Bahamas (12.4%, a difference of 0.020%), Immigrants from Burma/Myanmar (12.4%, a difference of 0.050%), European (12.4%, a difference of 0.050%), Panamanian (12.4%, a difference of 0.060%), and Samoan (12.4%, a difference of 0.060%).
| Demographics | Rating | Rank | Female Disability |
| Swiss | 14.9 /100 | #210 | Poor 12.4% |
| Immigrants | Bosnia and Herzegovina | 14.8 /100 | #211 | Poor 12.4% |
| Ute | 14.7 /100 | #212 | Poor 12.4% |
| Immigrants | Thailand | 14.5 /100 | #213 | Poor 12.4% |
| Panamanians | 13.5 /100 | #214 | Poor 12.4% |
| Samoans | 13.4 /100 | #215 | Poor 12.4% |
| Immigrants | Burma/Myanmar | 13.3 /100 | #216 | Poor 12.4% |
| British | 12.7 /100 | #217 | Poor 12.4% |
| Immigrants | Bahamas | 12.5 /100 | #218 | Poor 12.4% |
| Europeans | 12.1 /100 | #219 | Poor 12.4% |
| Bahamians | 11.1 /100 | #220 | Poor 12.4% |
| Native Hawaiians | 10.8 /100 | #221 | Poor 12.4% |
| Italians | 10.7 /100 | #222 | Poor 12.4% |
| Guamanians/Chamorros | 9.5 /100 | #223 | Tragic 12.5% |
| Belizeans | 9.3 /100 | #224 | Tragic 12.5% |
Demographics Similar to Tlingit-Haida by Female Disability
In terms of female disability, the demographic groups most similar to Tlingit-Haida are Immigrants from Yemen (13.2%, a difference of 0.0%), Shoshone (13.2%, a difference of 0.060%), White/Caucasian (13.2%, a difference of 0.17%), Yakama (13.2%, a difference of 0.23%), and Yaqui (13.2%, a difference of 0.27%).
| Demographics | Rating | Rank | Female Disability |
| Welsh | 0.0 /100 | #282 | Tragic 13.1% |
| English | 0.0 /100 | #283 | Tragic 13.1% |
| Hmong | 0.0 /100 | #284 | Tragic 13.1% |
| Bangladeshis | 0.0 /100 | #285 | Tragic 13.1% |
| Fijians | 0.0 /100 | #286 | Tragic 13.1% |
| Yaqui | 0.0 /100 | #287 | Tragic 13.2% |
| Whites/Caucasians | 0.0 /100 | #288 | Tragic 13.2% |
| Tlingit-Haida | 0.0 /100 | #289 | Tragic 13.2% |
| Immigrants | Yemen | 0.0 /100 | #290 | Tragic 13.2% |
| Shoshone | 0.0 /100 | #291 | Tragic 13.2% |
| Yakama | 0.0 /100 | #292 | Tragic 13.2% |
| Marshallese | 0.0 /100 | #293 | Tragic 13.3% |
| Celtics | 0.0 /100 | #294 | Tragic 13.3% |
| French | 0.0 /100 | #295 | Tragic 13.3% |
| Nepalese | 0.0 /100 | #296 | Tragic 13.3% |