British vs Tlingit-Haida Householder Income Over 65 years
COMPARE
British
Tlingit-Haida
Householder Income Over 65 years
Householder Income Over 65 years Comparison
British
Tlingit-Haida
$63,940
HOUSEHOLDER INCOME OVER 65 YEARS
95.7/ 100
METRIC RATING
103rd/ 347
METRIC RANK
$62,922
HOUSEHOLDER INCOME OVER 65 YEARS
88.6/ 100
METRIC RATING
123rd/ 347
METRIC RANK
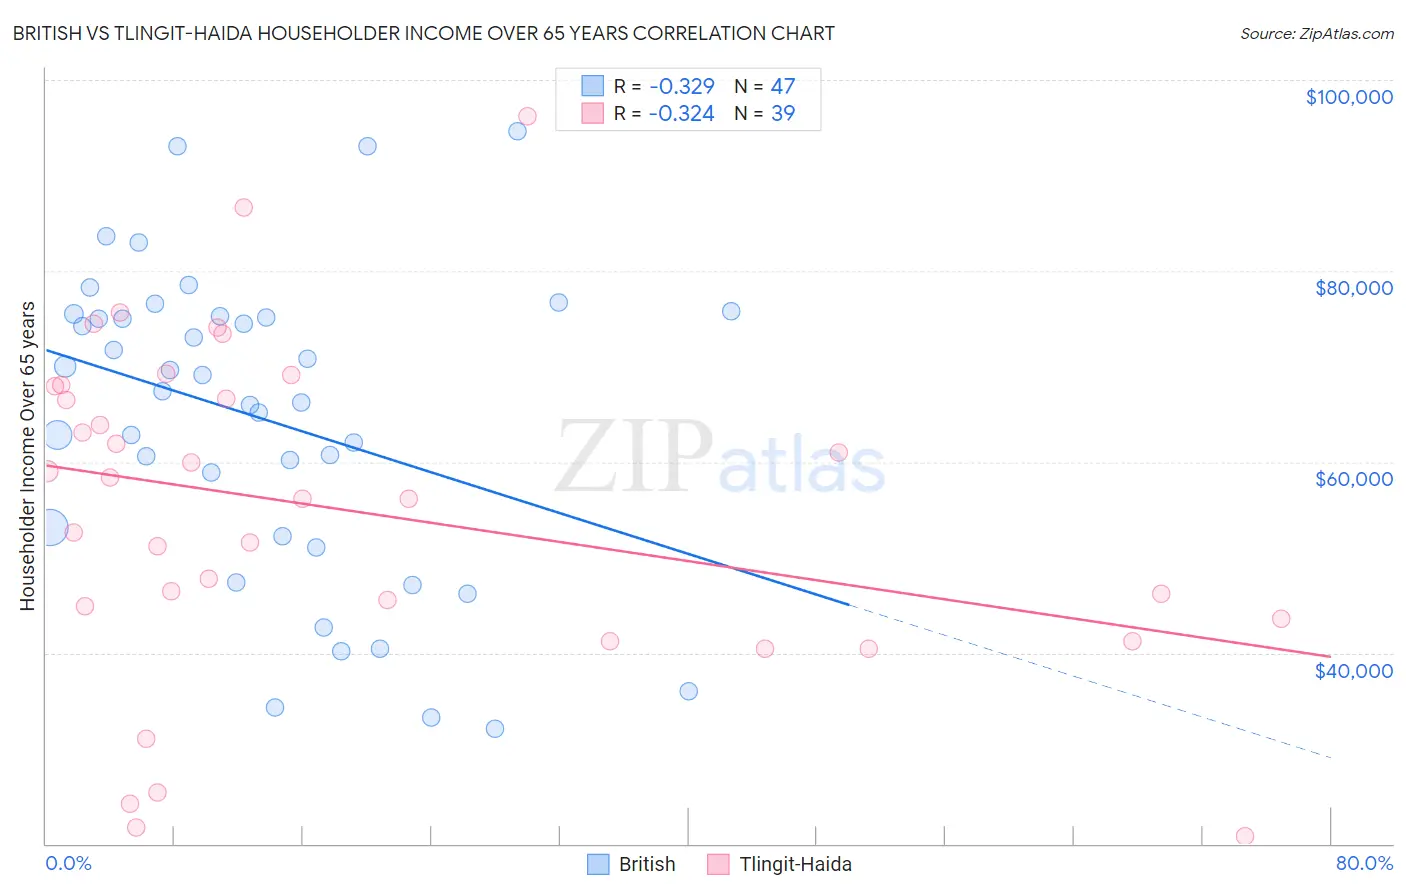
British vs Tlingit-Haida Householder Income Over 65 years Correlation Chart
The statistical analysis conducted on geographies consisting of 528,237,222 people shows a mild negative correlation between the proportion of British and household income with householder over the age of 65 in the United States with a correlation coefficient (R) of -0.329 and weighted average of $63,940. Similarly, the statistical analysis conducted on geographies consisting of 60,750,081 people shows a mild negative correlation between the proportion of Tlingit-Haida and household income with householder over the age of 65 in the United States with a correlation coefficient (R) of -0.324 and weighted average of $62,922, a difference of 1.6%.
Householder Income Over 65 years Correlation Summary
| Measurement | British | Tlingit-Haida |
| Minimum | $32,083 | $20,833 |
| Maximum | $94,602 | $96,250 |
| Range | $62,519 | $75,417 |
| Mean | $64,486 | $54,963 |
| Median | $67,398 | $56,173 |
| Interquartile 25% (IQ1) | $52,155 | $43,571 |
| Interquartile 75% (IQ3) | $75,312 | $67,937 |
| Interquartile Range (IQR) | $23,157 | $24,366 |
| Standard Deviation (Sample) | $16,132 | $17,428 |
| Standard Deviation (Population) | $15,959 | $17,203 |
Demographics Similar to British and Tlingit-Haida by Householder Income Over 65 years
In terms of householder income over 65 years, the demographic groups most similar to British are Immigrants from Cameroon ($63,907, a difference of 0.050%), Italian ($63,885, a difference of 0.080%), Immigrants from Argentina ($63,885, a difference of 0.090%), Pakistani ($63,844, a difference of 0.15%), and Palestinian ($63,800, a difference of 0.22%). Similarly, the demographic groups most similar to Tlingit-Haida are Immigrants from Moldova ($62,939, a difference of 0.030%), Immigrants from Vietnam ($63,014, a difference of 0.15%), Ukrainian ($63,032, a difference of 0.18%), Immigrants from Jordan ($63,041, a difference of 0.19%), and Danish ($63,117, a difference of 0.31%).
| Demographics | Rating | Rank | Householder Income Over 65 years |
| British | 95.7 /100 | #103 | Exceptional $63,940 |
| Immigrants | Cameroon | 95.6 /100 | #104 | Exceptional $63,907 |
| Italians | 95.5 /100 | #105 | Exceptional $63,885 |
| Immigrants | Argentina | 95.5 /100 | #106 | Exceptional $63,885 |
| Pakistanis | 95.3 /100 | #107 | Exceptional $63,844 |
| Palestinians | 95.1 /100 | #108 | Exceptional $63,800 |
| Europeans | 95.0 /100 | #109 | Exceptional $63,779 |
| Immigrants | Zimbabwe | 94.3 /100 | #110 | Exceptional $63,643 |
| Immigrants | Spain | 93.7 /100 | #111 | Exceptional $63,540 |
| Syrians | 93.4 /100 | #112 | Exceptional $63,494 |
| Immigrants | Serbia | 92.7 /100 | #113 | Exceptional $63,387 |
| Immigrants | Saudi Arabia | 92.4 /100 | #114 | Exceptional $63,355 |
| Croatians | 91.4 /100 | #115 | Exceptional $63,225 |
| Guamanians/Chamorros | 91.1 /100 | #116 | Exceptional $63,187 |
| Immigrants | Croatia | 90.9 /100 | #117 | Exceptional $63,168 |
| Danes | 90.5 /100 | #118 | Exceptional $63,117 |
| Immigrants | Jordan | 89.8 /100 | #119 | Excellent $63,041 |
| Ukrainians | 89.7 /100 | #120 | Excellent $63,032 |
| Immigrants | Vietnam | 89.5 /100 | #121 | Excellent $63,014 |
| Immigrants | Moldova | 88.7 /100 | #122 | Excellent $62,939 |
| Tlingit-Haida | 88.6 /100 | #123 | Excellent $62,922 |