British vs Cheyenne Female Disability
COMPARE
British
Cheyenne
Female Disability
Female Disability Comparison
British
Cheyenne
12.4%
FEMALE DISABILITY
12.7/ 100
METRIC RATING
217th/ 347
METRIC RANK
13.0%
FEMALE DISABILITY
0.1/ 100
METRIC RATING
275th/ 347
METRIC RANK
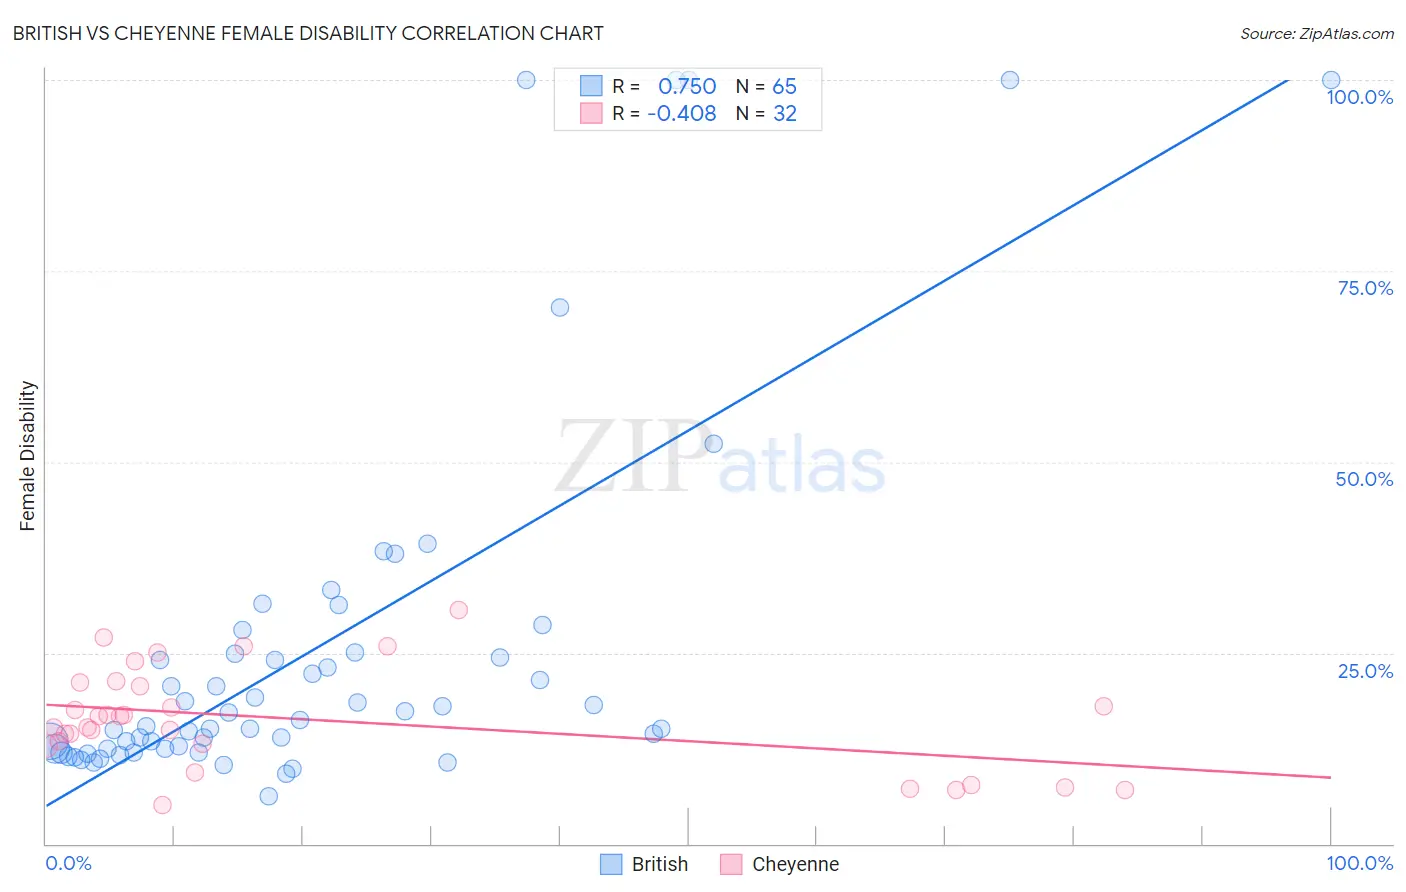
British vs Cheyenne Female Disability Correlation Chart
The statistical analysis conducted on geographies consisting of 531,338,456 people shows a strong positive correlation between the proportion of British and percentage of females with a disability in the United States with a correlation coefficient (R) of 0.750 and weighted average of 12.4%. Similarly, the statistical analysis conducted on geographies consisting of 80,710,076 people shows a moderate negative correlation between the proportion of Cheyenne and percentage of females with a disability in the United States with a correlation coefficient (R) of -0.408 and weighted average of 13.0%, a difference of 4.4%.
Female Disability Correlation Summary
| Measurement | British | Cheyenne |
| Minimum | 6.2% | 5.0% |
| Maximum | 100.0% | 30.6% |
| Range | 93.8% | 25.6% |
| Mean | 25.6% | 16.3% |
| Median | 16.2% | 16.0% |
| Interquartile 25% (IQ1) | 12.4% | 12.9% |
| Interquartile 75% (IQ3) | 25.0% | 20.9% |
| Interquartile Range (IQR) | 12.6% | 7.9% |
| Standard Deviation (Sample) | 24.1% | 6.6% |
| Standard Deviation (Population) | 23.9% | 6.5% |
Similar Demographics by Female Disability
Demographics Similar to British by Female Disability
In terms of female disability, the demographic groups most similar to British are Immigrants from Bahamas (12.4%, a difference of 0.020%), Immigrants from Burma/Myanmar (12.4%, a difference of 0.050%), European (12.4%, a difference of 0.050%), Panamanian (12.4%, a difference of 0.060%), and Samoan (12.4%, a difference of 0.060%).
| Demographics | Rating | Rank | Female Disability |
| Swiss | 14.9 /100 | #210 | Poor 12.4% |
| Immigrants | Bosnia and Herzegovina | 14.8 /100 | #211 | Poor 12.4% |
| Ute | 14.7 /100 | #212 | Poor 12.4% |
| Immigrants | Thailand | 14.5 /100 | #213 | Poor 12.4% |
| Panamanians | 13.5 /100 | #214 | Poor 12.4% |
| Samoans | 13.4 /100 | #215 | Poor 12.4% |
| Immigrants | Burma/Myanmar | 13.3 /100 | #216 | Poor 12.4% |
| British | 12.7 /100 | #217 | Poor 12.4% |
| Immigrants | Bahamas | 12.5 /100 | #218 | Poor 12.4% |
| Europeans | 12.1 /100 | #219 | Poor 12.4% |
| Bahamians | 11.1 /100 | #220 | Poor 12.4% |
| Native Hawaiians | 10.8 /100 | #221 | Poor 12.4% |
| Italians | 10.7 /100 | #222 | Poor 12.4% |
| Guamanians/Chamorros | 9.5 /100 | #223 | Tragic 12.5% |
| Belizeans | 9.3 /100 | #224 | Tragic 12.5% |
Demographics Similar to Cheyenne by Female Disability
In terms of female disability, the demographic groups most similar to Cheyenne are Portuguese (13.0%, a difference of 0.050%), Immigrants from Dominica (13.0%, a difference of 0.050%), Sioux (12.9%, a difference of 0.17%), German (12.9%, a difference of 0.19%), and Spanish (13.0%, a difference of 0.25%).
| Demographics | Rating | Rank | Female Disability |
| Immigrants | Laos | 0.4 /100 | #268 | Tragic 12.8% |
| Indonesians | 0.4 /100 | #269 | Tragic 12.8% |
| Immigrants | Liberia | 0.3 /100 | #270 | Tragic 12.9% |
| Dutch | 0.2 /100 | #271 | Tragic 12.9% |
| Germans | 0.1 /100 | #272 | Tragic 12.9% |
| Sioux | 0.1 /100 | #273 | Tragic 12.9% |
| Portuguese | 0.1 /100 | #274 | Tragic 13.0% |
| Cheyenne | 0.1 /100 | #275 | Tragic 13.0% |
| Immigrants | Dominica | 0.1 /100 | #276 | Tragic 13.0% |
| Spanish | 0.1 /100 | #277 | Tragic 13.0% |
| Scottish | 0.1 /100 | #278 | Tragic 13.0% |
| Arapaho | 0.1 /100 | #279 | Tragic 13.0% |
| Irish | 0.1 /100 | #280 | Tragic 13.1% |
| U.S. Virgin Islanders | 0.1 /100 | #281 | Tragic 13.1% |
| Welsh | 0.0 /100 | #282 | Tragic 13.1% |