British vs Tlingit-Haida College, 1 year or more
COMPARE
British
Tlingit-Haida
College, 1 year or more
College, 1 year or more Comparison
British
Tlingit-Haida
62.3%
COLLEGE, 1 YEAR OR MORE
97.4/ 100
METRIC RATING
95th/ 347
METRIC RANK
59.4%
COLLEGE, 1 YEAR OR MORE
48.4/ 100
METRIC RATING
177th/ 347
METRIC RANK
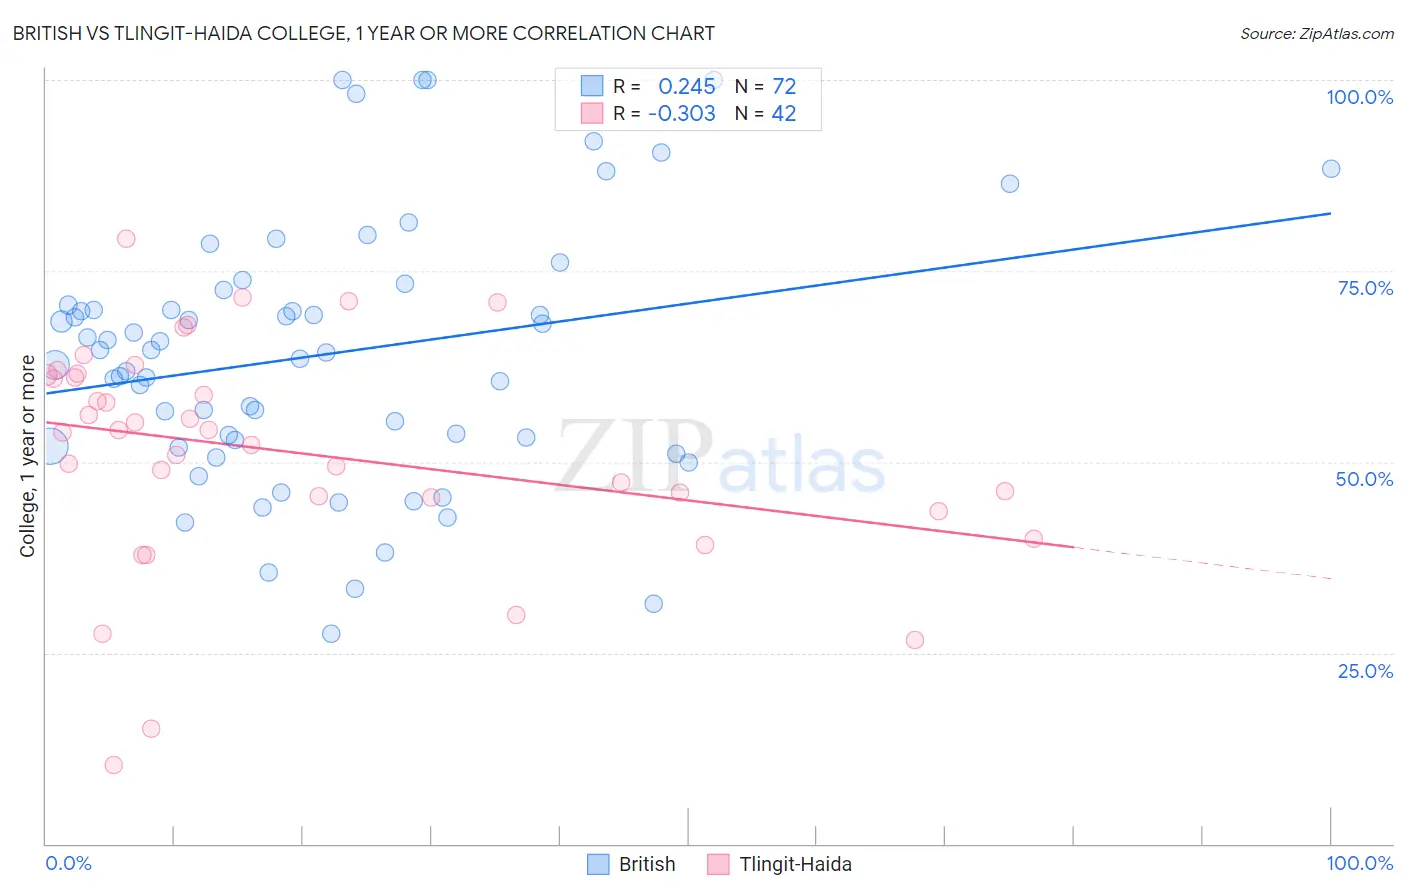
British vs Tlingit-Haida College, 1 year or more Correlation Chart
The statistical analysis conducted on geographies consisting of 531,458,915 people shows a weak positive correlation between the proportion of British and percentage of population with at least college, 1 year or more education in the United States with a correlation coefficient (R) of 0.245 and weighted average of 62.3%. Similarly, the statistical analysis conducted on geographies consisting of 60,872,339 people shows a mild negative correlation between the proportion of Tlingit-Haida and percentage of population with at least college, 1 year or more education in the United States with a correlation coefficient (R) of -0.303 and weighted average of 59.4%, a difference of 4.9%.
College, 1 year or more Correlation Summary
| Measurement | British | Tlingit-Haida |
| Minimum | 27.5% | 10.3% |
| Maximum | 100.0% | 79.3% |
| Range | 72.5% | 69.0% |
| Mean | 64.1% | 51.3% |
| Median | 64.6% | 54.0% |
| Interquartile 25% (IQ1) | 52.5% | 45.3% |
| Interquartile 75% (IQ3) | 71.5% | 61.5% |
| Interquartile Range (IQR) | 19.0% | 16.1% |
| Standard Deviation (Sample) | 17.1% | 14.8% |
| Standard Deviation (Population) | 17.0% | 14.6% |
Similar Demographics by College, 1 year or more
Demographics Similar to British by College, 1 year or more
In terms of college, 1 year or more, the demographic groups most similar to British are Immigrants from Croatia (62.3%, a difference of 0.10%), Chinese (62.2%, a difference of 0.12%), Jordanian (62.2%, a difference of 0.12%), Carpatho Rusyn (62.2%, a difference of 0.12%), and Croatian (62.2%, a difference of 0.13%).
| Demographics | Rating | Rank | College, 1 year or more |
| Greeks | 98.3 /100 | #88 | Exceptional 62.6% |
| Immigrants | Ethiopia | 98.2 /100 | #89 | Exceptional 62.6% |
| Immigrants | Western Asia | 97.9 /100 | #90 | Exceptional 62.5% |
| Immigrants | Eastern Europe | 97.8 /100 | #91 | Exceptional 62.4% |
| Immigrants | Egypt | 97.8 /100 | #92 | Exceptional 62.4% |
| Romanians | 97.7 /100 | #93 | Exceptional 62.4% |
| Immigrants | Croatia | 97.6 /100 | #94 | Exceptional 62.3% |
| British | 97.4 /100 | #95 | Exceptional 62.3% |
| Chinese | 97.2 /100 | #96 | Exceptional 62.2% |
| Jordanians | 97.2 /100 | #97 | Exceptional 62.2% |
| Carpatho Rusyns | 97.2 /100 | #98 | Exceptional 62.2% |
| Croatians | 97.1 /100 | #99 | Exceptional 62.2% |
| Icelanders | 96.8 /100 | #100 | Exceptional 62.1% |
| Swedes | 96.8 /100 | #101 | Exceptional 62.1% |
| Luxembourgers | 96.7 /100 | #102 | Exceptional 62.1% |
Demographics Similar to Tlingit-Haida by College, 1 year or more
In terms of college, 1 year or more, the demographic groups most similar to Tlingit-Haida are Czechoslovakian (59.4%, a difference of 0.0%), Sri Lankan (59.4%, a difference of 0.030%), Immigrants from Poland (59.4%, a difference of 0.030%), Celtic (59.4%, a difference of 0.080%), and Bermudan (59.3%, a difference of 0.10%).
| Demographics | Rating | Rank | College, 1 year or more |
| Welsh | 52.4 /100 | #170 | Average 59.5% |
| Immigrants | Albania | 52.3 /100 | #171 | Average 59.5% |
| Immigrants | Sierra Leone | 52.2 /100 | #172 | Average 59.5% |
| Immigrants | Oceania | 51.2 /100 | #173 | Average 59.4% |
| Celtics | 50.0 /100 | #174 | Average 59.4% |
| Sri Lankans | 49.0 /100 | #175 | Average 59.4% |
| Immigrants | Poland | 48.9 /100 | #176 | Average 59.4% |
| Tlingit-Haida | 48.4 /100 | #177 | Average 59.4% |
| Czechoslovakians | 48.3 /100 | #178 | Average 59.4% |
| Bermudans | 46.6 /100 | #179 | Average 59.3% |
| Yugoslavians | 44.1 /100 | #180 | Average 59.2% |
| Swiss | 43.4 /100 | #181 | Average 59.2% |
| Immigrants | Bosnia and Herzegovina | 42.8 /100 | #182 | Average 59.2% |
| German Russians | 39.3 /100 | #183 | Fair 59.1% |
| Spaniards | 38.3 /100 | #184 | Fair 59.0% |