British vs Tlingit-Haida In Labor Force | Age 25-29
COMPARE
British
Tlingit-Haida
In Labor Force | Age 25-29
In Labor Force | Age 25-29 Comparison
British
Tlingit-Haida
84.7%
IN LABOR FORCE | AGE 25-29
60.4/ 100
METRIC RATING
157th/ 347
METRIC RANK
84.4%
IN LABOR FORCE | AGE 25-29
19.3/ 100
METRIC RATING
197th/ 347
METRIC RANK
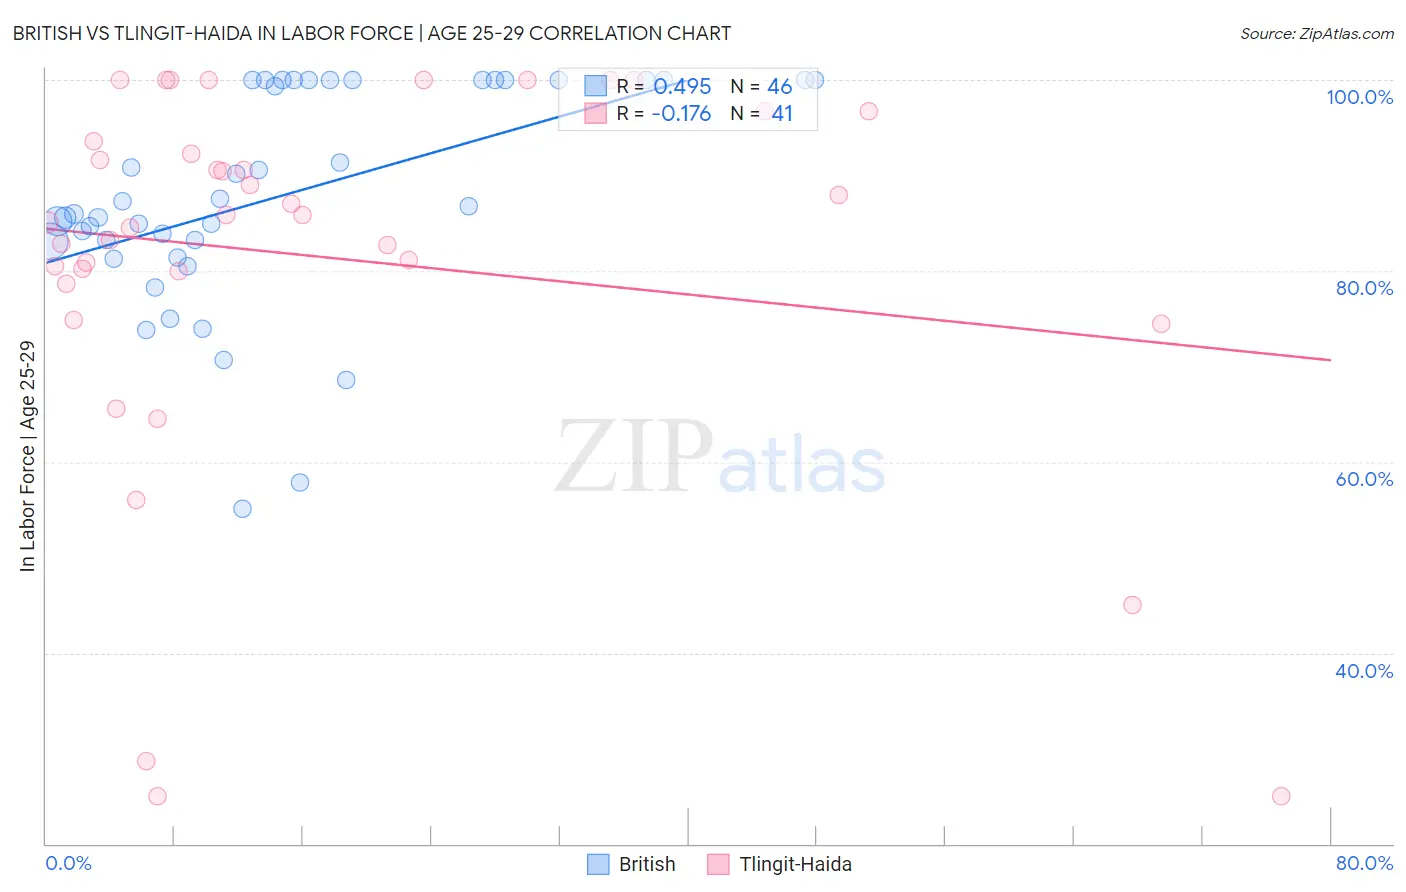
British vs Tlingit-Haida In Labor Force | Age 25-29 Correlation Chart
The statistical analysis conducted on geographies consisting of 530,868,549 people shows a moderate positive correlation between the proportion of British and labor force participation rate among population between the ages 25 and 29 in the United States with a correlation coefficient (R) of 0.495 and weighted average of 84.7%. Similarly, the statistical analysis conducted on geographies consisting of 60,865,267 people shows a poor negative correlation between the proportion of Tlingit-Haida and labor force participation rate among population between the ages 25 and 29 in the United States with a correlation coefficient (R) of -0.176 and weighted average of 84.4%, a difference of 0.34%.
In Labor Force | Age 25-29 Correlation Summary
| Measurement | British | Tlingit-Haida |
| Minimum | 55.0% | 25.0% |
| Maximum | 100.0% | 100.0% |
| Range | 45.0% | 75.0% |
| Mean | 87.7% | 81.4% |
| Median | 86.4% | 85.8% |
| Interquartile 25% (IQ1) | 83.1% | 79.3% |
| Interquartile 75% (IQ3) | 100.0% | 95.2% |
| Interquartile Range (IQR) | 16.9% | 15.8% |
| Standard Deviation (Sample) | 11.5% | 19.9% |
| Standard Deviation (Population) | 11.4% | 19.6% |
Similar Demographics by In Labor Force | Age 25-29
Demographics Similar to British by In Labor Force | Age 25-29
In terms of in labor force | age 25-29, the demographic groups most similar to British are French (84.7%, a difference of 0.0%), Immigrants from Ghana (84.7%, a difference of 0.0%), Immigrants from Western Africa (84.7%, a difference of 0.0%), Immigrants from Taiwan (84.7%, a difference of 0.010%), and Immigrants from Sri Lanka (84.7%, a difference of 0.010%).
| Demographics | Rating | Rank | In Labor Force | Age 25-29 |
| Swiss | 64.7 /100 | #150 | Good 84.7% |
| Colombians | 62.8 /100 | #151 | Good 84.7% |
| Immigrants | Pakistan | 62.7 /100 | #152 | Good 84.7% |
| Immigrants | Taiwan | 62.2 /100 | #153 | Good 84.7% |
| Immigrants | Sri Lanka | 61.7 /100 | #154 | Good 84.7% |
| Indians (Asian) | 61.6 /100 | #155 | Good 84.7% |
| French | 61.0 /100 | #156 | Good 84.7% |
| British | 60.4 /100 | #157 | Good 84.7% |
| Immigrants | Ghana | 60.2 /100 | #158 | Good 84.7% |
| Immigrants | Western Africa | 60.1 /100 | #159 | Good 84.7% |
| Immigrants | Peru | 58.6 /100 | #160 | Average 84.7% |
| Canadians | 58.5 /100 | #161 | Average 84.7% |
| Immigrants | Colombia | 58.3 /100 | #162 | Average 84.7% |
| Argentineans | 57.9 /100 | #163 | Average 84.7% |
| Ghanaians | 57.6 /100 | #164 | Average 84.7% |
Demographics Similar to Tlingit-Haida by In Labor Force | Age 25-29
In terms of in labor force | age 25-29, the demographic groups most similar to Tlingit-Haida are Immigrants from South Eastern Asia (84.4%, a difference of 0.0%), Immigrants from Iraq (84.4%, a difference of 0.0%), Immigrants from Germany (84.4%, a difference of 0.010%), Portuguese (84.4%, a difference of 0.020%), and Immigrants from Israel (84.4%, a difference of 0.020%).
| Demographics | Rating | Rank | In Labor Force | Age 25-29 |
| Welsh | 31.1 /100 | #190 | Fair 84.5% |
| Zimbabweans | 28.7 /100 | #191 | Fair 84.5% |
| English | 25.8 /100 | #192 | Fair 84.5% |
| South American Indians | 25.0 /100 | #193 | Fair 84.5% |
| Portuguese | 21.2 /100 | #194 | Fair 84.4% |
| Immigrants | Israel | 20.8 /100 | #195 | Fair 84.4% |
| Immigrants | South Eastern Asia | 19.5 /100 | #196 | Poor 84.4% |
| Tlingit-Haida | 19.3 /100 | #197 | Poor 84.4% |
| Immigrants | Iraq | 19.0 /100 | #198 | Poor 84.4% |
| Immigrants | Germany | 18.3 /100 | #199 | Poor 84.4% |
| Immigrants | Kazakhstan | 17.5 /100 | #200 | Poor 84.4% |
| Laotians | 16.6 /100 | #201 | Poor 84.4% |
| Afghans | 15.9 /100 | #202 | Poor 84.4% |
| Immigrants | Afghanistan | 15.6 /100 | #203 | Poor 84.4% |
| Venezuelans | 15.1 /100 | #204 | Poor 84.4% |