British vs Korean 9th Grade
COMPARE
British
Korean
9th Grade
9th Grade Comparison
British
Koreans
96.3%
9TH GRADE
100.0/ 100
METRIC RATING
31st/ 347
METRIC RANK
94.3%
9TH GRADE
2.9/ 100
METRIC RATING
237th/ 347
METRIC RANK
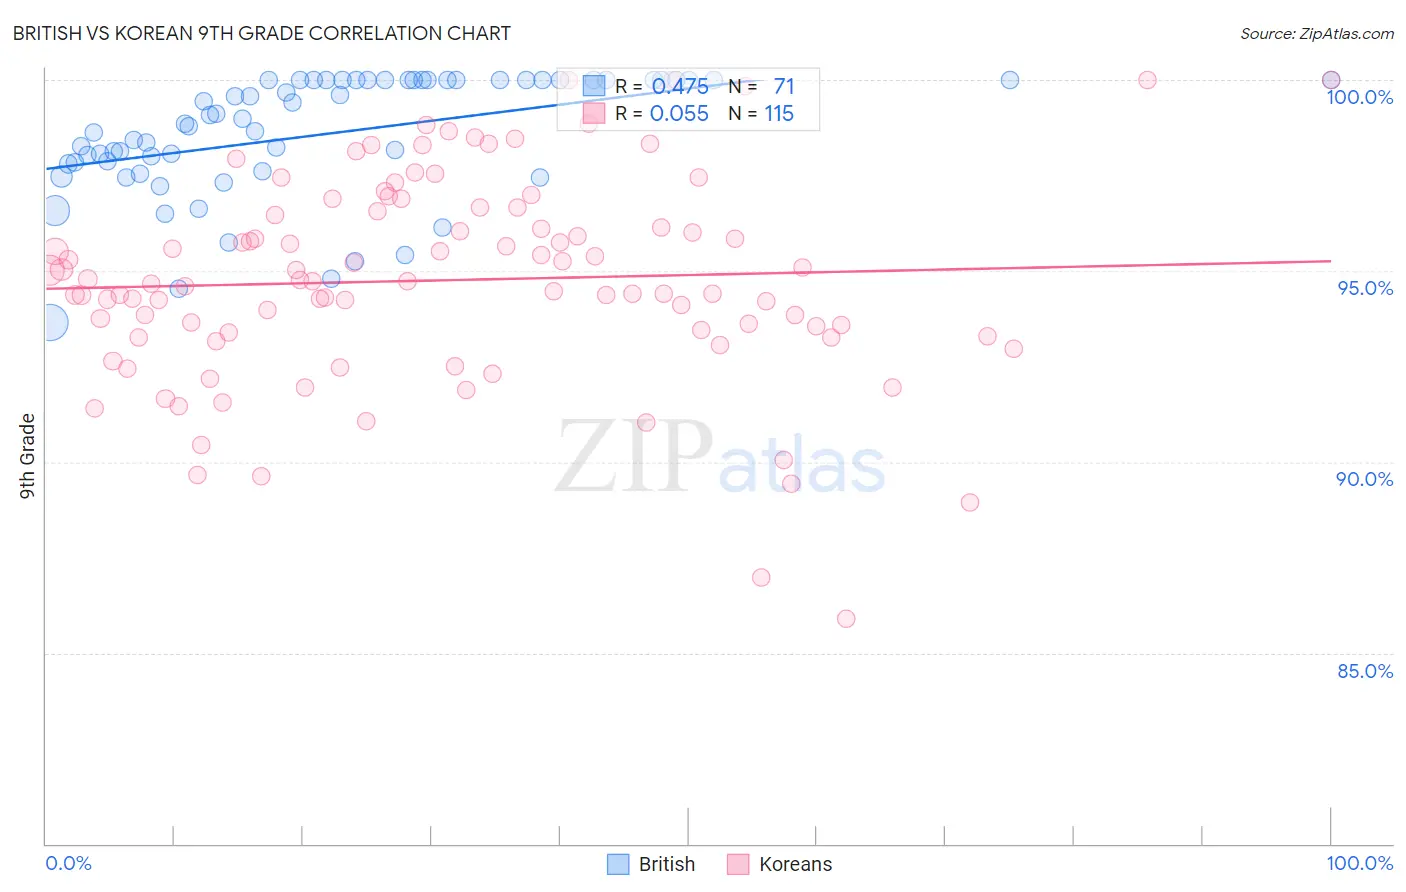
British vs Korean 9th Grade Correlation Chart
The statistical analysis conducted on geographies consisting of 531,463,107 people shows a moderate positive correlation between the proportion of British and percentage of population with at least 9th grade education in the United States with a correlation coefficient (R) of 0.475 and weighted average of 96.3%. Similarly, the statistical analysis conducted on geographies consisting of 510,943,943 people shows a slight positive correlation between the proportion of Koreans and percentage of population with at least 9th grade education in the United States with a correlation coefficient (R) of 0.055 and weighted average of 94.3%, a difference of 2.1%.
9th Grade Correlation Summary
| Measurement | British | Korean |
| Minimum | 93.7% | 85.9% |
| Maximum | 100.0% | 100.0% |
| Range | 6.3% | 14.1% |
| Mean | 98.6% | 94.8% |
| Median | 99.0% | 94.7% |
| Interquartile 25% (IQ1) | 97.8% | 93.3% |
| Interquartile 75% (IQ3) | 100.0% | 96.5% |
| Interquartile Range (IQR) | 2.2% | 3.3% |
| Standard Deviation (Sample) | 1.6% | 2.7% |
| Standard Deviation (Population) | 1.6% | 2.7% |
Similar Demographics by 9th Grade
Demographics Similar to British by 9th Grade
In terms of 9th grade, the demographic groups most similar to British are Maltese (96.3%, a difference of 0.0%), Belgian (96.3%, a difference of 0.0%), Luxembourger (96.3%, a difference of 0.010%), Scotch-Irish (96.3%, a difference of 0.030%), and Eastern European (96.3%, a difference of 0.030%).
| Demographics | Rating | Rank | 9th Grade |
| Latvians | 100.0 /100 | #24 | Exceptional 96.4% |
| French | 100.0 /100 | #25 | Exceptional 96.3% |
| French Canadians | 100.0 /100 | #26 | Exceptional 96.3% |
| Scotch-Irish | 100.0 /100 | #27 | Exceptional 96.3% |
| Eastern Europeans | 100.0 /100 | #28 | Exceptional 96.3% |
| Chinese | 100.0 /100 | #29 | Exceptional 96.3% |
| Maltese | 100.0 /100 | #30 | Exceptional 96.3% |
| British | 100.0 /100 | #31 | Exceptional 96.3% |
| Belgians | 100.0 /100 | #32 | Exceptional 96.3% |
| Luxembourgers | 100.0 /100 | #33 | Exceptional 96.3% |
| Hungarians | 100.0 /100 | #34 | Exceptional 96.2% |
| Bulgarians | 99.9 /100 | #35 | Exceptional 96.2% |
| Northern Europeans | 99.9 /100 | #36 | Exceptional 96.2% |
| Estonians | 99.9 /100 | #37 | Exceptional 96.1% |
| Immigrants | Scotland | 99.9 /100 | #38 | Exceptional 96.1% |
Demographics Similar to Koreans by 9th Grade
In terms of 9th grade, the demographic groups most similar to Koreans are Somali (94.3%, a difference of 0.0%), South American Indian (94.3%, a difference of 0.0%), Immigrants from China (94.3%, a difference of 0.0%), Immigrants from Ethiopia (94.3%, a difference of 0.010%), and Spanish American (94.2%, a difference of 0.020%).
| Demographics | Rating | Rank | 9th Grade |
| Apache | 4.2 /100 | #230 | Tragic 94.3% |
| Immigrants | Panama | 4.0 /100 | #231 | Tragic 94.3% |
| Immigrants | Africa | 3.9 /100 | #232 | Tragic 94.3% |
| Nigerians | 3.7 /100 | #233 | Tragic 94.3% |
| Costa Ricans | 3.5 /100 | #234 | Tragic 94.3% |
| Bolivians | 3.3 /100 | #235 | Tragic 94.3% |
| Somalis | 2.9 /100 | #236 | Tragic 94.3% |
| Koreans | 2.9 /100 | #237 | Tragic 94.3% |
| South American Indians | 2.8 /100 | #238 | Tragic 94.3% |
| Immigrants | China | 2.8 /100 | #239 | Tragic 94.3% |
| Immigrants | Ethiopia | 2.7 /100 | #240 | Tragic 94.3% |
| Spanish Americans | 2.6 /100 | #241 | Tragic 94.2% |
| Immigrants | Middle Africa | 2.2 /100 | #242 | Tragic 94.2% |
| Immigrants | Cameroon | 2.1 /100 | #243 | Tragic 94.2% |
| Dutch West Indians | 2.0 /100 | #244 | Tragic 94.2% |