Immigrants from Sweden vs Immigrants from Eritrea Male Disability
COMPARE
Immigrants from Sweden
Immigrants from Eritrea
Male Disability
Male Disability Comparison
Immigrants from Sweden
Immigrants from Eritrea
10.7%
MALE DISABILITY
96.9/ 100
METRIC RATING
94th/ 347
METRIC RANK
10.4%
MALE DISABILITY
99.6/ 100
METRIC RATING
55th/ 347
METRIC RANK
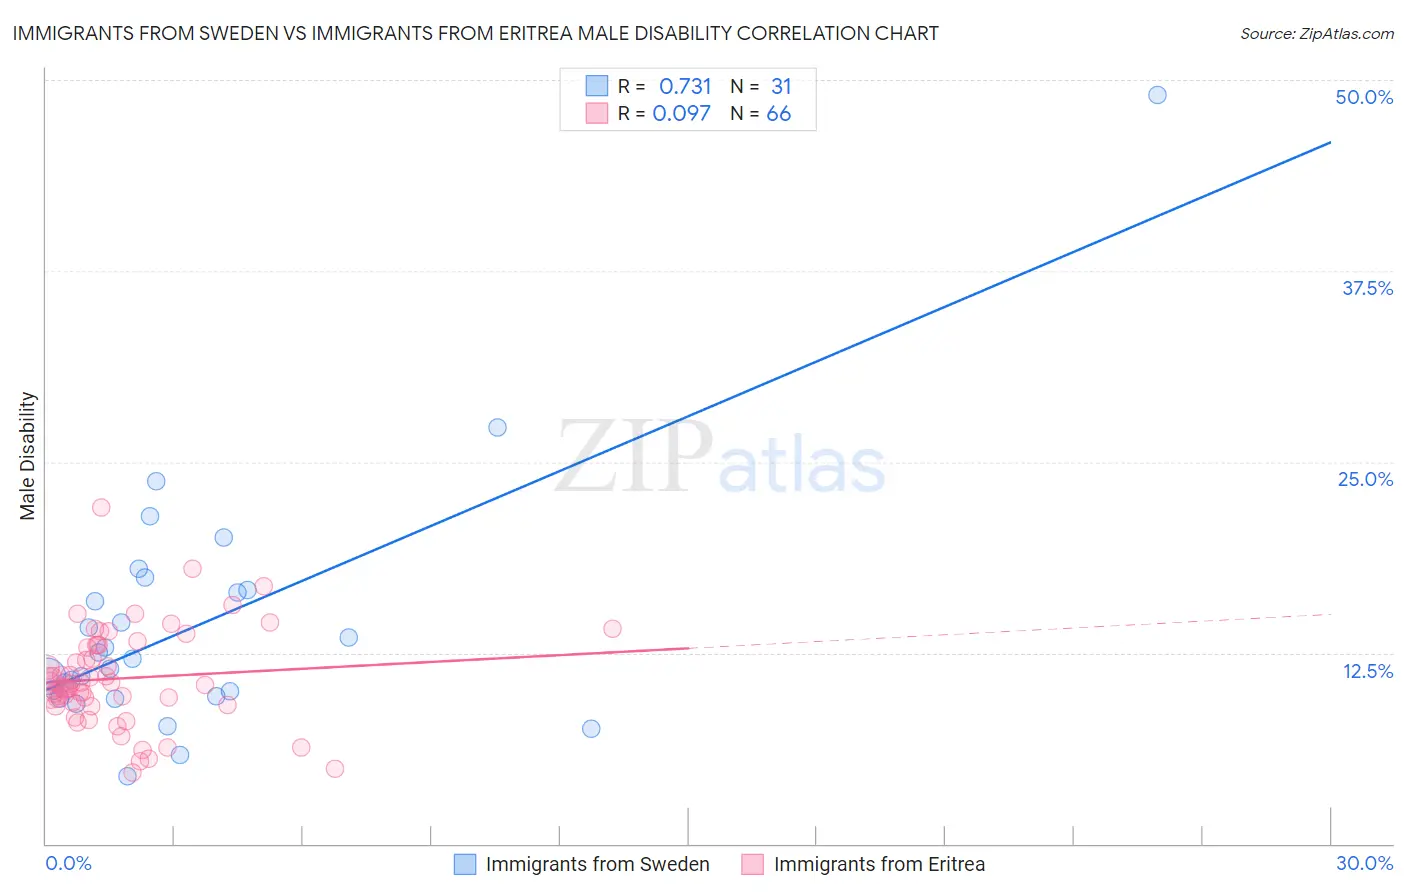
Immigrants from Sweden vs Immigrants from Eritrea Male Disability Correlation Chart
The statistical analysis conducted on geographies consisting of 164,748,272 people shows a strong positive correlation between the proportion of Immigrants from Sweden and percentage of males with a disability in the United States with a correlation coefficient (R) of 0.731 and weighted average of 10.7%. Similarly, the statistical analysis conducted on geographies consisting of 104,852,788 people shows a slight positive correlation between the proportion of Immigrants from Eritrea and percentage of males with a disability in the United States with a correlation coefficient (R) of 0.097 and weighted average of 10.4%, a difference of 3.0%.
Male Disability Correlation Summary
| Measurement | Immigrants from Sweden | Immigrants from Eritrea |
| Minimum | 4.4% | 4.7% |
| Maximum | 49.0% | 22.0% |
| Range | 44.6% | 17.3% |
| Mean | 14.3% | 10.8% |
| Median | 12.1% | 10.4% |
| Interquartile 25% (IQ1) | 9.7% | 9.2% |
| Interquartile 75% (IQ3) | 16.6% | 13.0% |
| Interquartile Range (IQR) | 6.9% | 3.8% |
| Standard Deviation (Sample) | 8.2% | 3.2% |
| Standard Deviation (Population) | 8.1% | 3.1% |
Similar Demographics by Male Disability
Demographics Similar to Immigrants from Sweden by Male Disability
In terms of male disability, the demographic groups most similar to Immigrants from Sweden are Chilean (10.7%, a difference of 0.030%), Immigrants from St. Vincent and the Grenadines (10.7%, a difference of 0.11%), Nicaraguan (10.7%, a difference of 0.13%), Immigrants from Armenia (10.7%, a difference of 0.15%), and Immigrants from Romania (10.7%, a difference of 0.21%).
| Demographics | Rating | Rank | Male Disability |
| Immigrants | Vietnam | 97.9 /100 | #87 | Exceptional 10.6% |
| Immigrants | Western Asia | 97.8 /100 | #88 | Exceptional 10.6% |
| Immigrants | Nicaragua | 97.8 /100 | #89 | Exceptional 10.6% |
| Immigrants | Morocco | 97.7 /100 | #90 | Exceptional 10.6% |
| Immigrants | France | 97.6 /100 | #91 | Exceptional 10.6% |
| Palestinians | 97.4 /100 | #92 | Exceptional 10.7% |
| Immigrants | St. Vincent and the Grenadines | 97.1 /100 | #93 | Exceptional 10.7% |
| Immigrants | Sweden | 96.9 /100 | #94 | Exceptional 10.7% |
| Chileans | 96.9 /100 | #95 | Exceptional 10.7% |
| Nicaraguans | 96.6 /100 | #96 | Exceptional 10.7% |
| Immigrants | Armenia | 96.6 /100 | #97 | Exceptional 10.7% |
| Immigrants | Romania | 96.5 /100 | #98 | Exceptional 10.7% |
| Immigrants | Switzerland | 96.1 /100 | #99 | Exceptional 10.7% |
| Immigrants | Kazakhstan | 95.9 /100 | #100 | Exceptional 10.7% |
| Immigrants | Greece | 95.6 /100 | #101 | Exceptional 10.7% |
Demographics Similar to Immigrants from Eritrea by Male Disability
In terms of male disability, the demographic groups most similar to Immigrants from Eritrea are Peruvian (10.4%, a difference of 0.020%), Tongan (10.4%, a difference of 0.040%), Immigrants from Uzbekistan (10.4%, a difference of 0.060%), Immigrants from South America (10.4%, a difference of 0.060%), and Immigrants from Saudi Arabia (10.4%, a difference of 0.080%).
| Demographics | Rating | Rank | Male Disability |
| Israelis | 99.7 /100 | #48 | Exceptional 10.3% |
| Immigrants | Spain | 99.7 /100 | #49 | Exceptional 10.3% |
| South Americans | 99.6 /100 | #50 | Exceptional 10.3% |
| Salvadorans | 99.6 /100 | #51 | Exceptional 10.4% |
| Immigrants | Saudi Arabia | 99.6 /100 | #52 | Exceptional 10.4% |
| Immigrants | Uzbekistan | 99.6 /100 | #53 | Exceptional 10.4% |
| Peruvians | 99.6 /100 | #54 | Exceptional 10.4% |
| Immigrants | Eritrea | 99.6 /100 | #55 | Exceptional 10.4% |
| Tongans | 99.6 /100 | #56 | Exceptional 10.4% |
| Immigrants | South America | 99.6 /100 | #57 | Exceptional 10.4% |
| Immigrants | Japan | 99.5 /100 | #58 | Exceptional 10.4% |
| Immigrants | Australia | 99.5 /100 | #59 | Exceptional 10.4% |
| Immigrants | Colombia | 99.5 /100 | #60 | Exceptional 10.4% |
| Immigrants | Northern Africa | 99.4 /100 | #61 | Exceptional 10.4% |
| Immigrants | Ecuador | 99.3 /100 | #62 | Exceptional 10.4% |