Brazilian vs Immigrants from Eritrea Child Poverty Under the Age of 5
COMPARE
Brazilian
Immigrants from Eritrea
Child Poverty Under the Age of 5
Child Poverty Under the Age of 5 Comparison
Brazilians
Immigrants from Eritrea
16.4%
CHILD POVERTY UNDER THE AGE OF 5
87.8/ 100
METRIC RATING
135th/ 347
METRIC RANK
19.1%
CHILD POVERTY UNDER THE AGE OF 5
1.5/ 100
METRIC RATING
226th/ 347
METRIC RANK
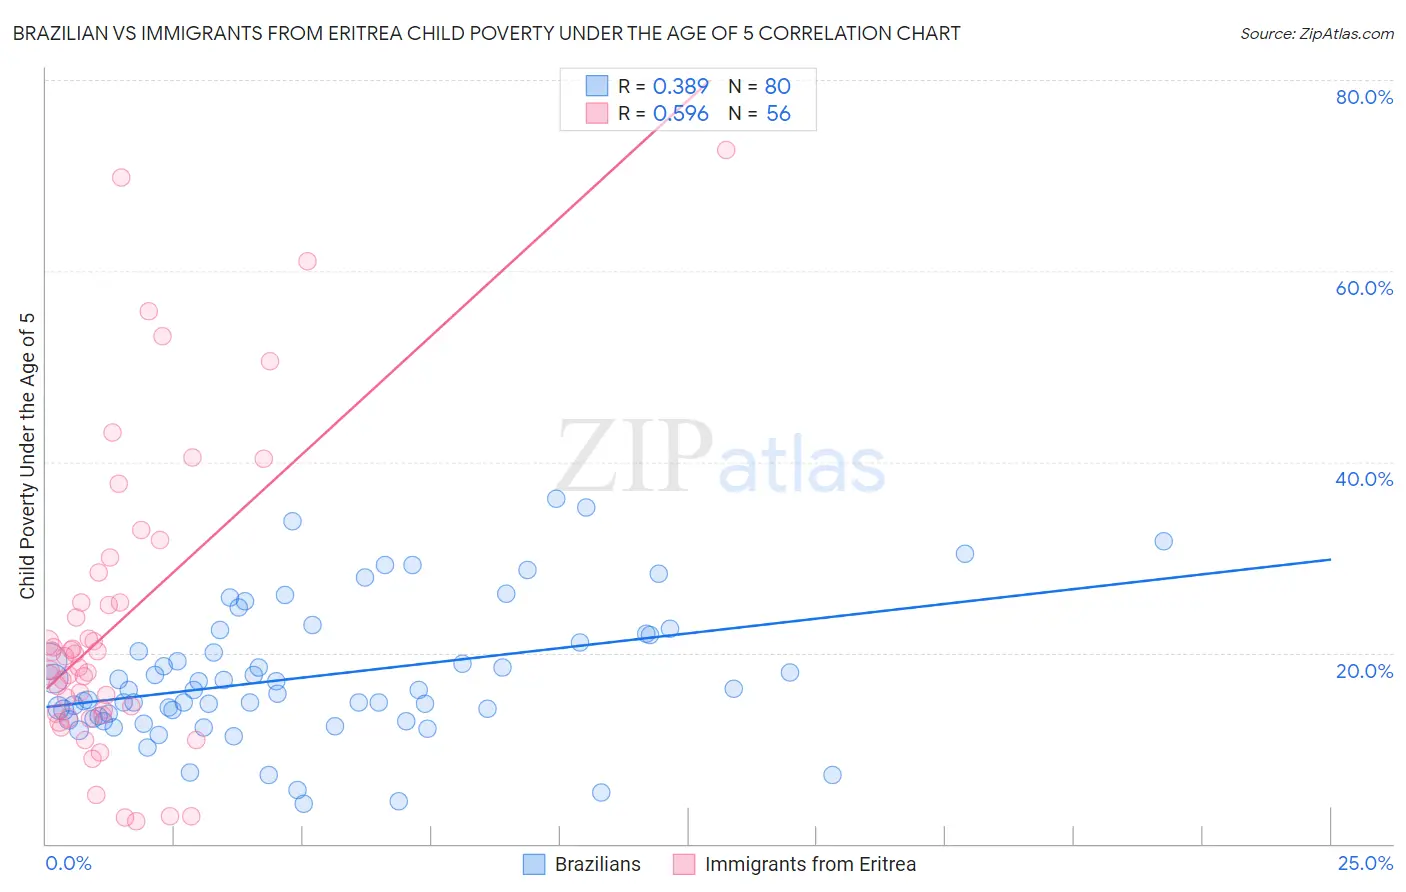
Brazilian vs Immigrants from Eritrea Child Poverty Under the Age of 5 Correlation Chart
The statistical analysis conducted on geographies consisting of 312,012,194 people shows a mild positive correlation between the proportion of Brazilians and poverty level among children under the age of 5 in the United States with a correlation coefficient (R) of 0.389 and weighted average of 16.4%. Similarly, the statistical analysis conducted on geographies consisting of 103,980,872 people shows a substantial positive correlation between the proportion of Immigrants from Eritrea and poverty level among children under the age of 5 in the United States with a correlation coefficient (R) of 0.596 and weighted average of 19.1%, a difference of 16.7%.
Child Poverty Under the Age of 5 Correlation Summary
| Measurement | Brazilian | Immigrants from Eritrea |
| Minimum | 4.1% | 2.3% |
| Maximum | 36.1% | 72.7% |
| Range | 31.9% | 70.4% |
| Mean | 17.5% | 23.3% |
| Median | 16.1% | 19.0% |
| Interquartile 25% (IQ1) | 13.2% | 13.6% |
| Interquartile 75% (IQ3) | 21.5% | 26.8% |
| Interquartile Range (IQR) | 8.2% | 13.2% |
| Standard Deviation (Sample) | 7.0% | 16.1% |
| Standard Deviation (Population) | 7.0% | 15.9% |
Similar Demographics by Child Poverty Under the Age of 5
Demographics Similar to Brazilians by Child Poverty Under the Age of 5
In terms of child poverty under the age of 5, the demographic groups most similar to Brazilians are Immigrants from North Macedonia (16.4%, a difference of 0.010%), Icelander (16.3%, a difference of 0.030%), Immigrants from Northern Africa (16.4%, a difference of 0.060%), Serbian (16.3%, a difference of 0.10%), and Finnish (16.3%, a difference of 0.13%).
| Demographics | Rating | Rank | Child Poverty Under the Age of 5 |
| South Africans | 90.1 /100 | #128 | Exceptional 16.2% |
| British | 89.4 /100 | #129 | Excellent 16.3% |
| Immigrants | Norway | 89.3 /100 | #130 | Excellent 16.3% |
| Finns | 88.3 /100 | #131 | Excellent 16.3% |
| Serbians | 88.2 /100 | #132 | Excellent 16.3% |
| Icelanders | 87.9 /100 | #133 | Excellent 16.3% |
| Immigrants | North Macedonia | 87.8 /100 | #134 | Excellent 16.4% |
| Brazilians | 87.8 /100 | #135 | Excellent 16.4% |
| Immigrants | Northern Africa | 87.5 /100 | #136 | Excellent 16.4% |
| Immigrants | Chile | 85.3 /100 | #137 | Excellent 16.4% |
| Germans | 84.8 /100 | #138 | Excellent 16.5% |
| Immigrants | Hungary | 84.5 /100 | #139 | Excellent 16.5% |
| Guamanians/Chamorros | 84.2 /100 | #140 | Excellent 16.5% |
| Immigrants | Western Europe | 83.3 /100 | #141 | Excellent 16.5% |
| Portuguese | 83.0 /100 | #142 | Excellent 16.5% |
Demographics Similar to Immigrants from Eritrea by Child Poverty Under the Age of 5
In terms of child poverty under the age of 5, the demographic groups most similar to Immigrants from Eritrea are Nigerian (19.1%, a difference of 0.020%), Nicaraguan (19.1%, a difference of 0.050%), Cuban (19.1%, a difference of 0.16%), Alsatian (19.1%, a difference of 0.18%), and Cape Verdean (19.1%, a difference of 0.18%).
| Demographics | Rating | Rank | Child Poverty Under the Age of 5 |
| German Russians | 3.0 /100 | #219 | Tragic 18.8% |
| Immigrants | Azores | 2.6 /100 | #220 | Tragic 18.9% |
| Immigrants | Nigeria | 2.1 /100 | #221 | Tragic 19.0% |
| Alsatians | 1.7 /100 | #222 | Tragic 19.1% |
| Cubans | 1.7 /100 | #223 | Tragic 19.1% |
| Nicaraguans | 1.6 /100 | #224 | Tragic 19.1% |
| Nigerians | 1.6 /100 | #225 | Tragic 19.1% |
| Immigrants | Eritrea | 1.5 /100 | #226 | Tragic 19.1% |
| Cape Verdeans | 1.4 /100 | #227 | Tragic 19.1% |
| Immigrants | Sudan | 1.3 /100 | #228 | Tragic 19.2% |
| Ghanaians | 1.2 /100 | #229 | Tragic 19.2% |
| Ecuadorians | 1.2 /100 | #230 | Tragic 19.2% |
| Bermudans | 1.2 /100 | #231 | Tragic 19.2% |
| Trinidadians and Tobagonians | 0.9 /100 | #232 | Tragic 19.3% |
| Sudanese | 0.9 /100 | #233 | Tragic 19.3% |