Bolivian vs Czechoslovakian In Labor Force | Age > 16
COMPARE
Bolivian
Czechoslovakian
In Labor Force | Age > 16
In Labor Force | Age > 16 Comparison
Bolivians
Czechoslovakians
68.2%
IN LABOR FORCE | AGE > 16
100.0/ 100
METRIC RATING
11th/ 347
METRIC RANK
64.3%
IN LABOR FORCE | AGE > 16
1.4/ 100
METRIC RATING
253rd/ 347
METRIC RANK
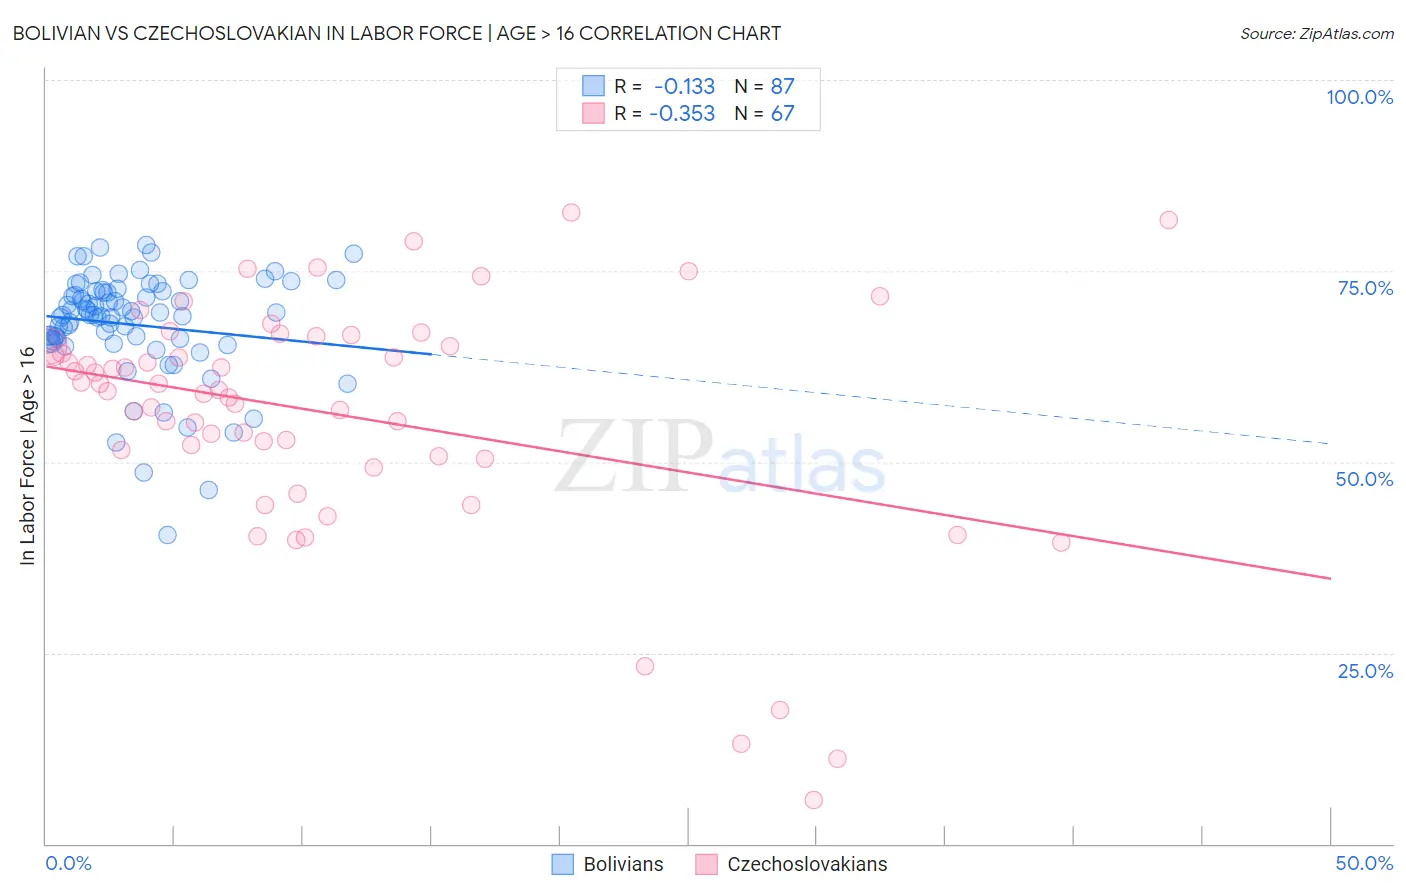
Bolivian vs Czechoslovakian In Labor Force | Age > 16 Correlation Chart
The statistical analysis conducted on geographies consisting of 184,675,621 people shows a poor negative correlation between the proportion of Bolivians and labor force participation rate among population ages 16 and over in the United States with a correlation coefficient (R) of -0.133 and weighted average of 68.2%. Similarly, the statistical analysis conducted on geographies consisting of 368,673,303 people shows a mild negative correlation between the proportion of Czechoslovakians and labor force participation rate among population ages 16 and over in the United States with a correlation coefficient (R) of -0.353 and weighted average of 64.3%, a difference of 6.0%.
In Labor Force | Age > 16 Correlation Summary
| Measurement | Bolivian | Czechoslovakian |
| Minimum | 40.4% | 5.7% |
| Maximum | 78.4% | 82.7% |
| Range | 38.0% | 77.0% |
| Mean | 68.0% | 56.3% |
| Median | 69.2% | 59.4% |
| Interquartile 25% (IQ1) | 65.9% | 50.8% |
| Interquartile 75% (IQ3) | 72.3% | 65.2% |
| Interquartile Range (IQR) | 6.4% | 14.4% |
| Standard Deviation (Sample) | 7.0% | 15.8% |
| Standard Deviation (Population) | 6.9% | 15.7% |
Similar Demographics by In Labor Force | Age > 16
Demographics Similar to Bolivians by In Labor Force | Age > 16
In terms of in labor force | age > 16, the demographic groups most similar to Bolivians are Sudanese (68.0%, a difference of 0.22%), Immigrants from Nepal (68.0%, a difference of 0.24%), Immigrants from Bolivia (68.4%, a difference of 0.37%), Immigrants from Eastern Africa (68.5%, a difference of 0.40%), and Immigrants from Sierra Leone (68.5%, a difference of 0.41%).
| Demographics | Rating | Rank | In Labor Force | Age > 16 |
| Immigrants | Somalia | 100.0 /100 | #4 | Exceptional 69.1% |
| Sierra Leoneans | 100.0 /100 | #5 | Exceptional 68.9% |
| Immigrants | Eritrea | 100.0 /100 | #6 | Exceptional 68.9% |
| Immigrants | Cameroon | 100.0 /100 | #7 | Exceptional 68.7% |
| Immigrants | Sierra Leone | 100.0 /100 | #8 | Exceptional 68.5% |
| Immigrants | Eastern Africa | 100.0 /100 | #9 | Exceptional 68.5% |
| Immigrants | Bolivia | 100.0 /100 | #10 | Exceptional 68.4% |
| Bolivians | 100.0 /100 | #11 | Exceptional 68.2% |
| Sudanese | 100.0 /100 | #12 | Exceptional 68.0% |
| Immigrants | Nepal | 100.0 /100 | #13 | Exceptional 68.0% |
| Liberians | 100.0 /100 | #14 | Exceptional 67.8% |
| Immigrants | Middle Africa | 100.0 /100 | #15 | Exceptional 67.7% |
| Immigrants | Sudan | 100.0 /100 | #16 | Exceptional 67.7% |
| Immigrants | India | 100.0 /100 | #17 | Exceptional 67.6% |
| Immigrants | Liberia | 100.0 /100 | #18 | Exceptional 67.6% |
Demographics Similar to Czechoslovakians by In Labor Force | Age > 16
In terms of in labor force | age > 16, the demographic groups most similar to Czechoslovakians are Immigrants from Uzbekistan (64.3%, a difference of 0.0%), Immigrants from Dominican Republic (64.4%, a difference of 0.010%), Portuguese (64.4%, a difference of 0.040%), British West Indian (64.4%, a difference of 0.060%), and German (64.4%, a difference of 0.070%).
| Demographics | Rating | Rank | In Labor Force | Age > 16 |
| Immigrants | Caribbean | 2.3 /100 | #246 | Tragic 64.4% |
| Swiss | 2.1 /100 | #247 | Tragic 64.4% |
| Immigrants | Barbados | 2.1 /100 | #248 | Tragic 64.4% |
| Germans | 1.8 /100 | #249 | Tragic 64.4% |
| British West Indians | 1.8 /100 | #250 | Tragic 64.4% |
| Portuguese | 1.6 /100 | #251 | Tragic 64.4% |
| Immigrants | Dominican Republic | 1.5 /100 | #252 | Tragic 64.4% |
| Czechoslovakians | 1.4 /100 | #253 | Tragic 64.3% |
| Immigrants | Uzbekistan | 1.4 /100 | #254 | Tragic 64.3% |
| Hispanics or Latinos | 1.1 /100 | #255 | Tragic 64.3% |
| Immigrants | Mexico | 1.0 /100 | #256 | Tragic 64.3% |
| Inupiat | 0.8 /100 | #257 | Tragic 64.3% |
| Immigrants | Scotland | 0.8 /100 | #258 | Tragic 64.2% |
| Immigrants | Western Europe | 0.7 /100 | #259 | Tragic 64.2% |
| Marshallese | 0.7 /100 | #260 | Tragic 64.2% |