Black/African American vs Latvian Disability Age 18 to 34
COMPARE
Black/African American
Latvian
Disability Age 18 to 34
Disability Age 18 to 34 Comparison
Blacks/African Americans
Latvians
7.7%
DISABILITY AGE 18 TO 34
0.0/ 100
METRIC RATING
292nd/ 347
METRIC RANK
6.8%
DISABILITY AGE 18 TO 34
11.1/ 100
METRIC RATING
210th/ 347
METRIC RANK
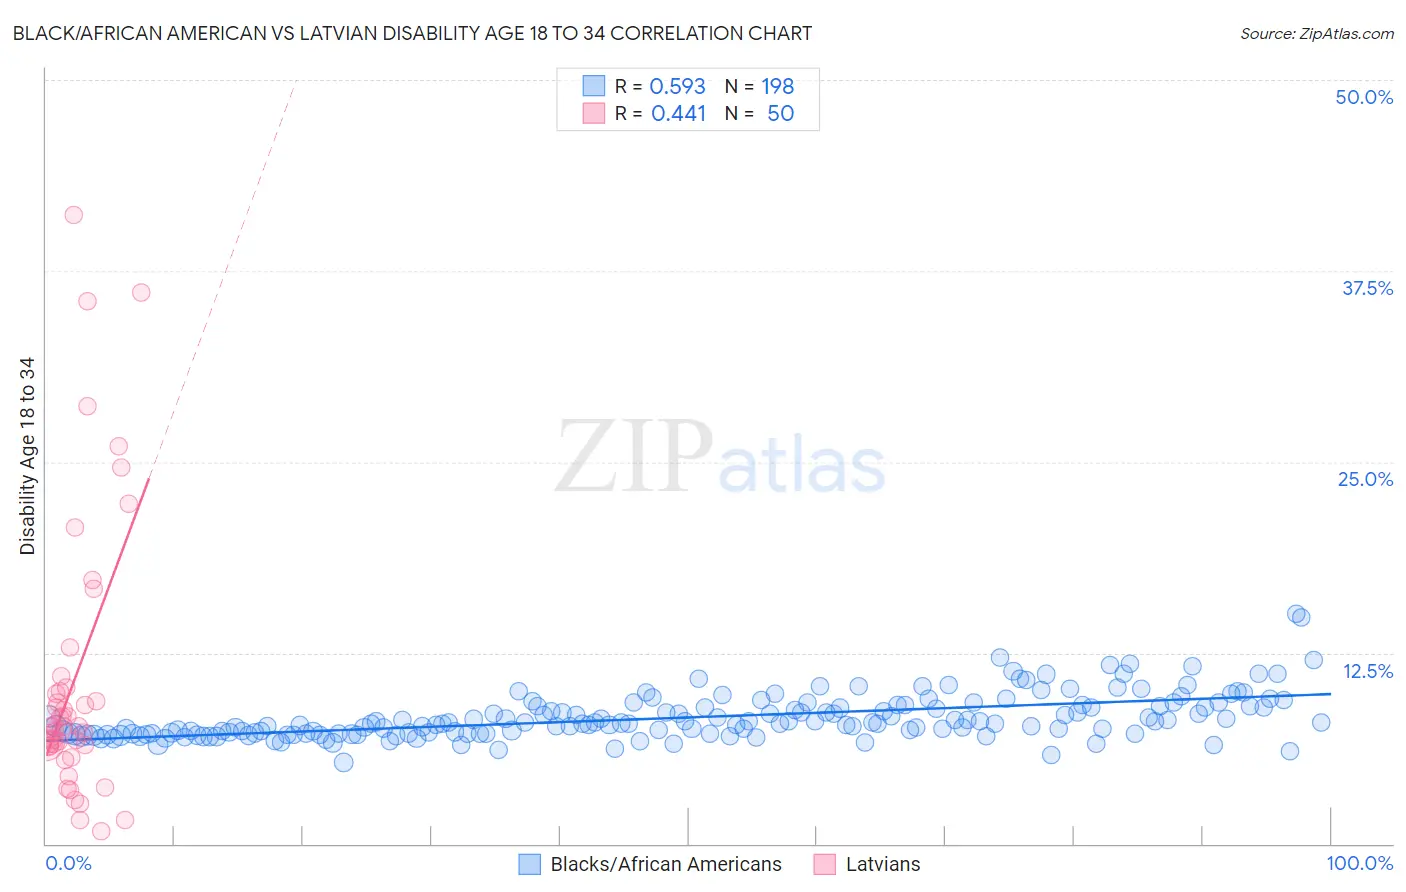
Black/African American vs Latvian Disability Age 18 to 34 Correlation Chart
The statistical analysis conducted on geographies consisting of 561,495,678 people shows a substantial positive correlation between the proportion of Blacks/African Americans and percentage of population with a disability between the ages 18 and 35 in the United States with a correlation coefficient (R) of 0.593 and weighted average of 7.7%. Similarly, the statistical analysis conducted on geographies consisting of 220,392,708 people shows a moderate positive correlation between the proportion of Latvians and percentage of population with a disability between the ages 18 and 35 in the United States with a correlation coefficient (R) of 0.441 and weighted average of 6.8%, a difference of 12.2%.
Disability Age 18 to 34 Correlation Summary
| Measurement | Black/African American | Latvian |
| Minimum | 5.3% | 0.83% |
| Maximum | 15.1% | 41.2% |
| Range | 9.7% | 40.3% |
| Mean | 8.3% | 10.8% |
| Median | 7.9% | 7.7% |
| Interquartile 25% (IQ1) | 7.2% | 6.4% |
| Interquartile 75% (IQ3) | 9.0% | 10.2% |
| Interquartile Range (IQR) | 1.8% | 3.8% |
| Standard Deviation (Sample) | 1.5% | 9.2% |
| Standard Deviation (Population) | 1.5% | 9.1% |
Similar Demographics by Disability Age 18 to 34
Demographics Similar to Blacks/African Americans by Disability Age 18 to 34
In terms of disability age 18 to 34, the demographic groups most similar to Blacks/African Americans are Scandinavian (7.7%, a difference of 0.060%), Immigrants from Cabo Verde (7.7%, a difference of 0.21%), Irish (7.7%, a difference of 0.22%), Tlingit-Haida (7.7%, a difference of 0.22%), and Slovak (7.7%, a difference of 0.27%).
| Demographics | Rating | Rank | Disability Age 18 to 34 |
| Swedes | 0.0 /100 | #285 | Tragic 7.5% |
| Celtics | 0.0 /100 | #286 | Tragic 7.6% |
| Norwegians | 0.0 /100 | #287 | Tragic 7.6% |
| Whites/Caucasians | 0.0 /100 | #288 | Tragic 7.6% |
| Immigrants | Nonimmigrants | 0.0 /100 | #289 | Tragic 7.6% |
| Slovaks | 0.0 /100 | #290 | Tragic 7.7% |
| Irish | 0.0 /100 | #291 | Tragic 7.7% |
| Blacks/African Americans | 0.0 /100 | #292 | Tragic 7.7% |
| Scandinavians | 0.0 /100 | #293 | Tragic 7.7% |
| Immigrants | Cabo Verde | 0.0 /100 | #294 | Tragic 7.7% |
| Tlingit-Haida | 0.0 /100 | #295 | Tragic 7.7% |
| Cape Verdeans | 0.0 /100 | #296 | Tragic 7.7% |
| Pueblo | 0.0 /100 | #297 | Tragic 7.7% |
| Dutch | 0.0 /100 | #298 | Tragic 7.7% |
| Germans | 0.0 /100 | #299 | Tragic 7.7% |
Demographics Similar to Latvians by Disability Age 18 to 34
In terms of disability age 18 to 34, the demographic groups most similar to Latvians are Immigrants from Burma/Myanmar (6.8%, a difference of 0.20%), Immigrants from Norway (6.8%, a difference of 0.20%), Immigrants from Scotland (6.8%, a difference of 0.22%), Mexican (6.8%, a difference of 0.24%), and Japanese (6.8%, a difference of 0.27%).
| Demographics | Rating | Rank | Disability Age 18 to 34 |
| Hispanics or Latinos | 13.8 /100 | #203 | Poor 6.8% |
| Immigrants | Bosnia and Herzegovina | 13.6 /100 | #204 | Poor 6.8% |
| Lebanese | 13.3 /100 | #205 | Poor 6.8% |
| Japanese | 12.8 /100 | #206 | Poor 6.8% |
| Mexicans | 12.6 /100 | #207 | Poor 6.8% |
| Immigrants | Scotland | 12.4 /100 | #208 | Poor 6.8% |
| Immigrants | Burma/Myanmar | 12.3 /100 | #209 | Poor 6.8% |
| Latvians | 11.1 /100 | #210 | Poor 6.8% |
| Immigrants | Norway | 10.0 /100 | #211 | Tragic 6.8% |
| Luxembourgers | 9.4 /100 | #212 | Tragic 6.9% |
| Immigrants | Western Europe | 9.1 /100 | #213 | Tragic 6.9% |
| Serbians | 8.2 /100 | #214 | Tragic 6.9% |
| Immigrants | Thailand | 7.5 /100 | #215 | Tragic 6.9% |
| Sudanese | 7.0 /100 | #216 | Tragic 6.9% |
| Immigrants | Kenya | 6.9 /100 | #217 | Tragic 6.9% |