Black/African American vs Immigrants from Mexico Unemployment Among Ages 60 to 64 years
COMPARE
Black/African American
Immigrants from Mexico
Unemployment Among Ages 60 to 64 years
Unemployment Among Ages 60 to 64 years Comparison
Blacks/African Americans
Immigrants from Mexico
5.3%
UNEMPLOYMENT AMONG AGES 60 TO 64 YEARS
0.0/ 100
METRIC RATING
294th/ 347
METRIC RANK
5.4%
UNEMPLOYMENT AMONG AGES 60 TO 64 YEARS
0.0/ 100
METRIC RATING
304th/ 347
METRIC RANK
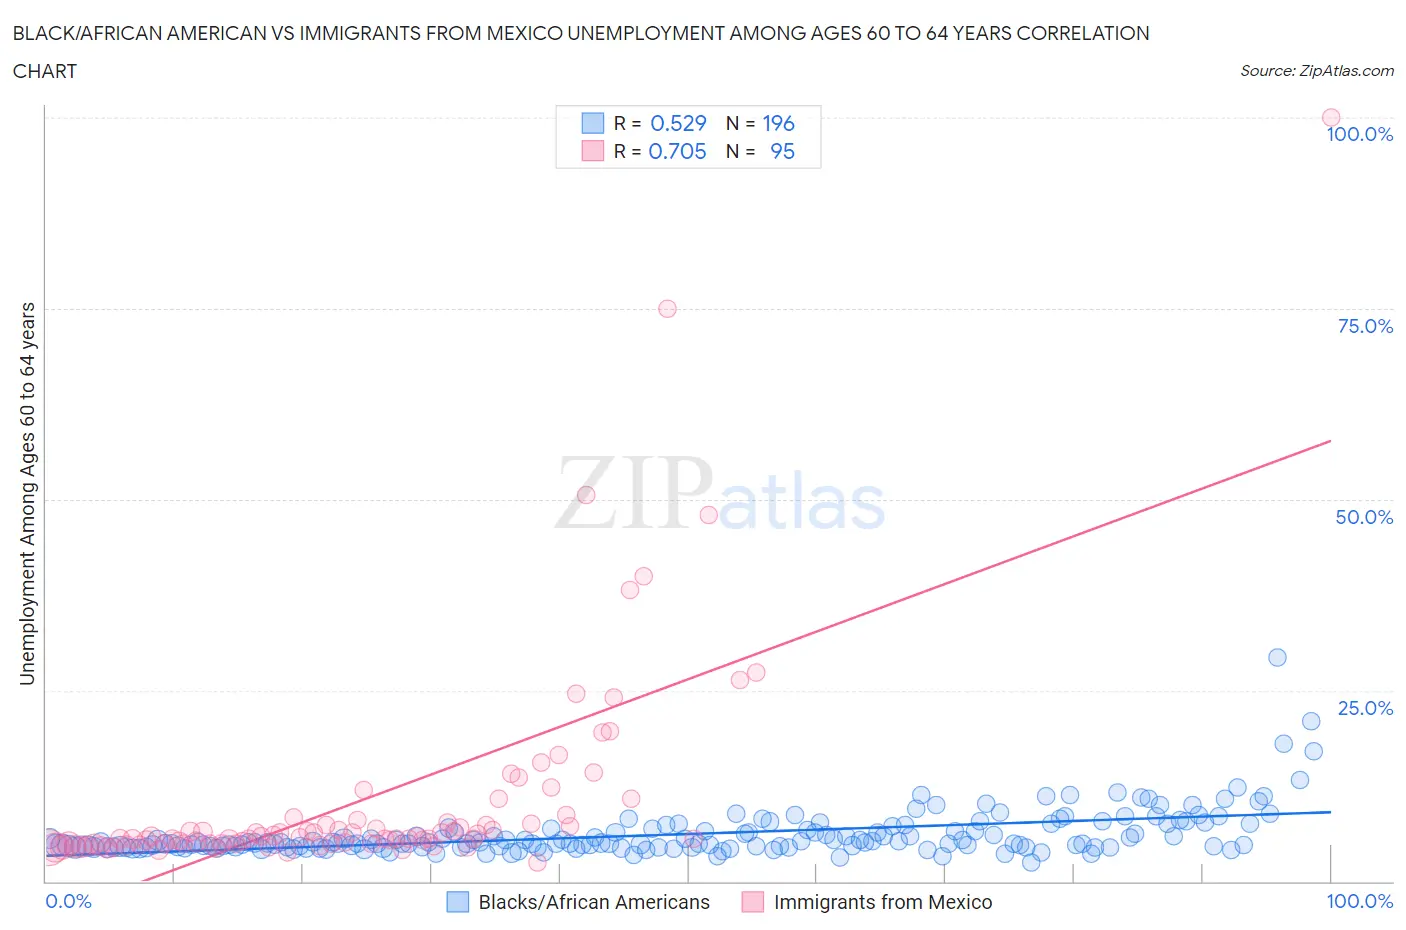
Black/African American vs Immigrants from Mexico Unemployment Among Ages 60 to 64 years Correlation Chart
The statistical analysis conducted on geographies consisting of 465,577,423 people shows a substantial positive correlation between the proportion of Blacks/African Americans and unemployment rate among population between the ages 60 and 64 in the United States with a correlation coefficient (R) of 0.529 and weighted average of 5.3%. Similarly, the statistical analysis conducted on geographies consisting of 436,043,576 people shows a strong positive correlation between the proportion of Immigrants from Mexico and unemployment rate among population between the ages 60 and 64 in the United States with a correlation coefficient (R) of 0.705 and weighted average of 5.4%, a difference of 1.4%.
Unemployment Among Ages 60 to 64 years Correlation Summary
| Measurement | Black/African American | Immigrants from Mexico |
| Minimum | 2.5% | 2.5% |
| Maximum | 29.2% | 100.0% |
| Range | 26.7% | 97.5% |
| Mean | 6.1% | 10.8% |
| Median | 5.0% | 5.8% |
| Interquartile 25% (IQ1) | 4.5% | 4.9% |
| Interquartile 75% (IQ3) | 6.7% | 8.0% |
| Interquartile Range (IQR) | 2.2% | 3.0% |
| Standard Deviation (Sample) | 3.1% | 14.5% |
| Standard Deviation (Population) | 3.1% | 14.5% |
Demographics Similar to Blacks/African Americans and Immigrants from Mexico by Unemployment Among Ages 60 to 64 years
In terms of unemployment among ages 60 to 64 years, the demographic groups most similar to Blacks/African Americans are Armenian (5.3%, a difference of 0.030%), Immigrants from Israel (5.3%, a difference of 0.11%), Immigrants from Latin America (5.3%, a difference of 0.13%), Hispanic or Latino (5.3%, a difference of 0.15%), and Jamaican (5.3%, a difference of 0.15%). Similarly, the demographic groups most similar to Immigrants from Mexico are Cypriot (5.4%, a difference of 0.020%), Bahamian (5.4%, a difference of 0.050%), Immigrants from Dominica (5.4%, a difference of 0.090%), Barbadian (5.4%, a difference of 0.14%), and Immigrants from Guyana (5.4%, a difference of 0.26%).
| Demographics | Rating | Rank | Unemployment Among Ages 60 to 64 years |
| Spanish Americans | 0.0 /100 | #289 | Tragic 5.3% |
| Immigrants | Trinidad and Tobago | 0.0 /100 | #290 | Tragic 5.3% |
| Hispanics or Latinos | 0.0 /100 | #291 | Tragic 5.3% |
| Immigrants | Latin America | 0.0 /100 | #292 | Tragic 5.3% |
| Immigrants | Israel | 0.0 /100 | #293 | Tragic 5.3% |
| Blacks/African Americans | 0.0 /100 | #294 | Tragic 5.3% |
| Armenians | 0.0 /100 | #295 | Tragic 5.3% |
| Jamaicans | 0.0 /100 | #296 | Tragic 5.3% |
| Osage | 0.0 /100 | #297 | Tragic 5.4% |
| Immigrants | Central America | 0.0 /100 | #298 | Tragic 5.4% |
| Immigrants | El Salvador | 0.0 /100 | #299 | Tragic 5.4% |
| Immigrants | Barbados | 0.0 /100 | #300 | Tragic 5.4% |
| Immigrants | Jamaica | 0.0 /100 | #301 | Tragic 5.4% |
| Barbadians | 0.0 /100 | #302 | Tragic 5.4% |
| Bahamians | 0.0 /100 | #303 | Tragic 5.4% |
| Immigrants | Mexico | 0.0 /100 | #304 | Tragic 5.4% |
| Cypriots | 0.0 /100 | #305 | Tragic 5.4% |
| Immigrants | Dominica | 0.0 /100 | #306 | Tragic 5.4% |
| Immigrants | Guyana | 0.0 /100 | #307 | Tragic 5.4% |
| Spanish American Indians | 0.0 /100 | #308 | Tragic 5.4% |
| Soviet Union | 0.0 /100 | #309 | Tragic 5.4% |