Spaniard vs Immigrants from Mexico Disability Age Over 75
COMPARE
Spaniard
Immigrants from Mexico
Disability Age Over 75
Disability Age Over 75 Comparison
Spaniards
Immigrants from Mexico
48.1%
DISABILITY AGE OVER 75
5.7/ 100
METRIC RATING
229th/ 347
METRIC RANK
51.1%
DISABILITY AGE OVER 75
0.0/ 100
METRIC RATING
314th/ 347
METRIC RANK
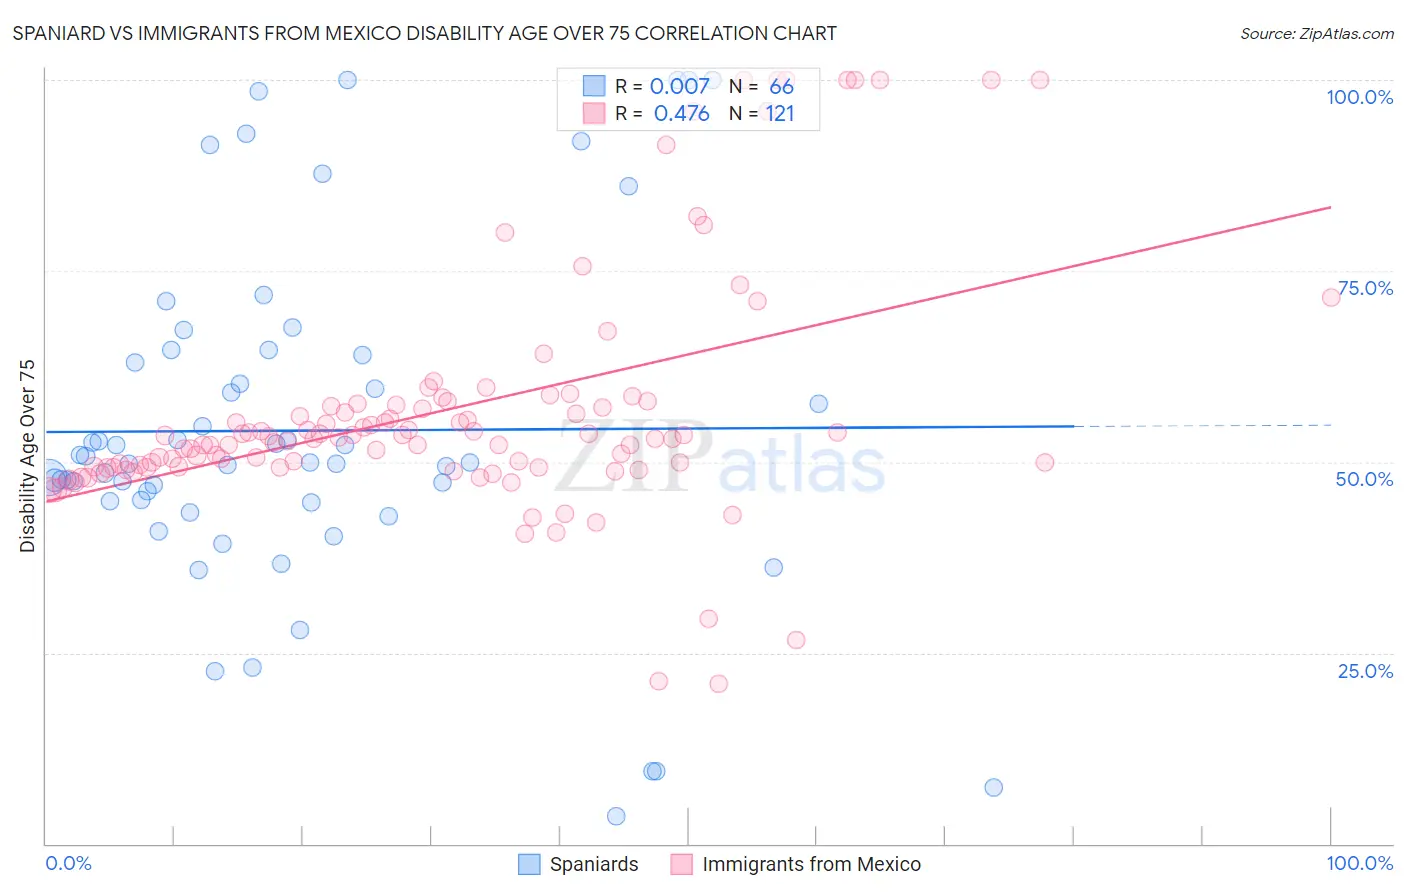
Spaniard vs Immigrants from Mexico Disability Age Over 75 Correlation Chart
The statistical analysis conducted on geographies consisting of 442,367,902 people shows no correlation between the proportion of Spaniards and percentage of population with a disability over the age of 75 in the United States with a correlation coefficient (R) of 0.007 and weighted average of 48.1%. Similarly, the statistical analysis conducted on geographies consisting of 512,333,705 people shows a moderate positive correlation between the proportion of Immigrants from Mexico and percentage of population with a disability over the age of 75 in the United States with a correlation coefficient (R) of 0.476 and weighted average of 51.1%, a difference of 6.3%.
Disability Age Over 75 Correlation Summary
| Measurement | Spaniard | Immigrants from Mexico |
| Minimum | 3.6% | 20.9% |
| Maximum | 100.0% | 100.0% |
| Range | 96.4% | 79.1% |
| Mean | 54.1% | 56.9% |
| Median | 50.0% | 53.0% |
| Interquartile 25% (IQ1) | 44.8% | 49.3% |
| Interquartile 75% (IQ3) | 64.0% | 57.6% |
| Interquartile Range (IQR) | 19.1% | 8.2% |
| Standard Deviation (Sample) | 22.3% | 15.9% |
| Standard Deviation (Population) | 22.1% | 15.9% |
Similar Demographics by Disability Age Over 75
Demographics Similar to Spaniards by Disability Age Over 75
In terms of disability age over 75, the demographic groups most similar to Spaniards are Immigrants from Liberia (48.1%, a difference of 0.020%), Nonimmigrants (48.0%, a difference of 0.070%), Zimbabwean (48.1%, a difference of 0.070%), Spanish (48.0%, a difference of 0.080%), and Liberian (48.0%, a difference of 0.090%).
| Demographics | Rating | Rank | Disability Age Over 75 |
| Barbadians | 6.8 /100 | #222 | Tragic 48.0% |
| Immigrants | Bangladesh | 6.8 /100 | #223 | Tragic 48.0% |
| Liberians | 6.7 /100 | #224 | Tragic 48.0% |
| Spanish | 6.5 /100 | #225 | Tragic 48.0% |
| Immigrants | Nonimmigrants | 6.5 /100 | #226 | Tragic 48.0% |
| Zimbabweans | 6.4 /100 | #227 | Tragic 48.1% |
| Immigrants | Liberia | 5.9 /100 | #228 | Tragic 48.1% |
| Spaniards | 5.7 /100 | #229 | Tragic 48.1% |
| Taiwanese | 4.4 /100 | #230 | Tragic 48.2% |
| Immigrants | Immigrants | 4.3 /100 | #231 | Tragic 48.2% |
| Indonesians | 4.2 /100 | #232 | Tragic 48.2% |
| Cree | 4.2 /100 | #233 | Tragic 48.2% |
| Sub-Saharan Africans | 3.8 /100 | #234 | Tragic 48.2% |
| Hmong | 3.8 /100 | #235 | Tragic 48.2% |
| Immigrants | Nicaragua | 3.2 /100 | #236 | Tragic 48.2% |
Demographics Similar to Immigrants from Mexico by Disability Age Over 75
In terms of disability age over 75, the demographic groups most similar to Immigrants from Mexico are Mexican (51.1%, a difference of 0.050%), Chickasaw (51.2%, a difference of 0.19%), Immigrants from the Azores (50.9%, a difference of 0.37%), Yakama (51.3%, a difference of 0.37%), and Cheyenne (50.9%, a difference of 0.42%).
| Demographics | Rating | Rank | Disability Age Over 75 |
| Immigrants | Fiji | 0.0 /100 | #307 | Tragic 50.6% |
| Hispanics or Latinos | 0.0 /100 | #308 | Tragic 50.6% |
| Aleuts | 0.0 /100 | #309 | Tragic 50.6% |
| Tlingit-Haida | 0.0 /100 | #310 | Tragic 50.6% |
| Cajuns | 0.0 /100 | #311 | Tragic 50.7% |
| Cheyenne | 0.0 /100 | #312 | Tragic 50.9% |
| Immigrants | Azores | 0.0 /100 | #313 | Tragic 50.9% |
| Immigrants | Mexico | 0.0 /100 | #314 | Tragic 51.1% |
| Mexicans | 0.0 /100 | #315 | Tragic 51.1% |
| Chickasaw | 0.0 /100 | #316 | Tragic 51.2% |
| Yakama | 0.0 /100 | #317 | Tragic 51.3% |
| Seminole | 0.0 /100 | #318 | Tragic 51.5% |
| Creek | 0.0 /100 | #319 | Tragic 51.5% |
| Paiute | 0.0 /100 | #320 | Tragic 51.5% |
| Dutch West Indians | 0.0 /100 | #321 | Tragic 51.5% |