Black/African American vs Immigrants from Mexico Median Family Income
COMPARE
Black/African American
Immigrants from Mexico
Median Family Income
Median Family Income Comparison
Blacks/African Americans
Immigrants from Mexico
$81,912
MEDIAN FAMILY INCOME
0.0/ 100
METRIC RATING
328th/ 347
METRIC RANK
$83,639
MEDIAN FAMILY INCOME
0.0/ 100
METRIC RATING
318th/ 347
METRIC RANK
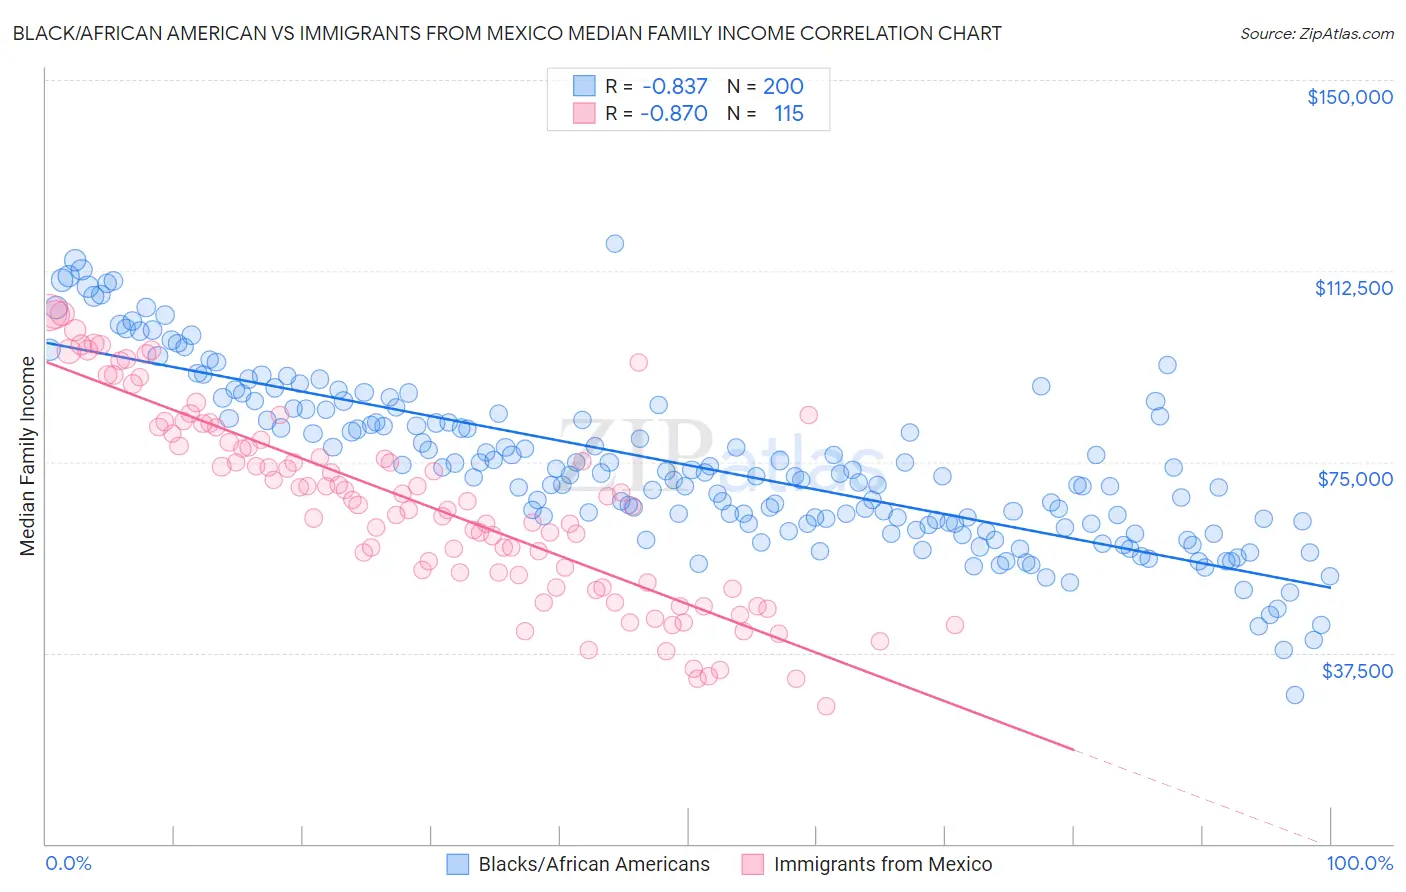
Black/African American vs Immigrants from Mexico Median Family Income Correlation Chart
The statistical analysis conducted on geographies consisting of 564,544,060 people shows a very strong negative correlation between the proportion of Blacks/African Americans and median family income in the United States with a correlation coefficient (R) of -0.837 and weighted average of $81,912. Similarly, the statistical analysis conducted on geographies consisting of 512,958,720 people shows a very strong negative correlation between the proportion of Immigrants from Mexico and median family income in the United States with a correlation coefficient (R) of -0.870 and weighted average of $83,639, a difference of 2.1%.
Median Family Income Correlation Summary
| Measurement | Black/African American | Immigrants from Mexico |
| Minimum | $29,315 | $27,125 |
| Maximum | $117,822 | $104,446 |
| Range | $88,507 | $77,321 |
| Mean | $74,336 | $66,857 |
| Median | $72,335 | $67,328 |
| Interquartile 25% (IQ1) | $62,832 | $51,313 |
| Interquartile 75% (IQ3) | $85,289 | $80,504 |
| Interquartile Range (IQR) | $22,457 | $29,191 |
| Standard Deviation (Sample) | $16,637 | $19,043 |
| Standard Deviation (Population) | $16,596 | $18,960 |
Demographics Similar to Blacks/African Americans and Immigrants from Mexico by Median Family Income
In terms of median family income, the demographic groups most similar to Blacks/African Americans are Dutch West Indian ($81,852, a difference of 0.070%), Arapaho ($82,064, a difference of 0.18%), Immigrants from Congo ($82,216, a difference of 0.37%), Sioux ($82,386, a difference of 0.58%), and Cheyenne ($81,385, a difference of 0.65%). Similarly, the demographic groups most similar to Immigrants from Mexico are Immigrants from Honduras ($83,618, a difference of 0.030%), Seminole ($83,354, a difference of 0.34%), Yakama ($83,932, a difference of 0.35%), Immigrants from Caribbean ($83,319, a difference of 0.38%), and Immigrants from Haiti ($84,018, a difference of 0.45%).
| Demographics | Rating | Rank | Median Family Income |
| Choctaw | 0.0 /100 | #313 | Tragic $84,835 |
| Immigrants | Bahamas | 0.0 /100 | #314 | Tragic $84,732 |
| Apache | 0.0 /100 | #315 | Tragic $84,451 |
| Immigrants | Haiti | 0.0 /100 | #316 | Tragic $84,018 |
| Yakama | 0.0 /100 | #317 | Tragic $83,932 |
| Immigrants | Mexico | 0.0 /100 | #318 | Tragic $83,639 |
| Immigrants | Honduras | 0.0 /100 | #319 | Tragic $83,618 |
| Seminole | 0.0 /100 | #320 | Tragic $83,354 |
| Immigrants | Caribbean | 0.0 /100 | #321 | Tragic $83,319 |
| Dominicans | 0.0 /100 | #322 | Tragic $82,888 |
| Bahamians | 0.0 /100 | #323 | Tragic $82,631 |
| Creek | 0.0 /100 | #324 | Tragic $82,560 |
| Sioux | 0.0 /100 | #325 | Tragic $82,386 |
| Immigrants | Congo | 0.0 /100 | #326 | Tragic $82,216 |
| Arapaho | 0.0 /100 | #327 | Tragic $82,064 |
| Blacks/African Americans | 0.0 /100 | #328 | Tragic $81,912 |
| Dutch West Indians | 0.0 /100 | #329 | Tragic $81,852 |
| Cheyenne | 0.0 /100 | #330 | Tragic $81,385 |
| Immigrants | Dominican Republic | 0.0 /100 | #331 | Tragic $81,233 |
| Natives/Alaskans | 0.0 /100 | #332 | Tragic $80,908 |
| Kiowa | 0.0 /100 | #333 | Tragic $80,885 |